We remind you that since the first quarter of 2024, we have changed our data collection methodology to account for the increase in channel capacity and attack volume. We now exclude all incidents with an intensity of less than 1 Gbps, considering them as “white noise,” which helps us focus on the most significant events.
The number of attacks at the network and transport layers (L3-L4) increased significantly in the third quarter of 2024 (+80% compared to Q2). This is likely due to seasonality: attackers begin “probing the defenses”, actively preparing for the holiday shopping season, which typically sees a peak in malicious activity.
In Q3, the distribution of attacks by vector changed significantly compared to Q2. Single-vector UDP flood attacks dominated, accounting for more than half of all L3-L4 attacks — 59.3%. IP fragmentation flood ranked second with a share of 20.35%. Rounding out the top three were multi-vector attacks, combining UDP+IP fragmentation flood, which made up 8.64% of the total attacks in the third quarter.
TCP flood attacks, which were the most common in the previous quarter, dropped to fourth place, accounting for only 3.07%. Multi-vector TCP+SYN+IP+UDP flood attacks ranked fifth, making up 1.54% of all attacks.
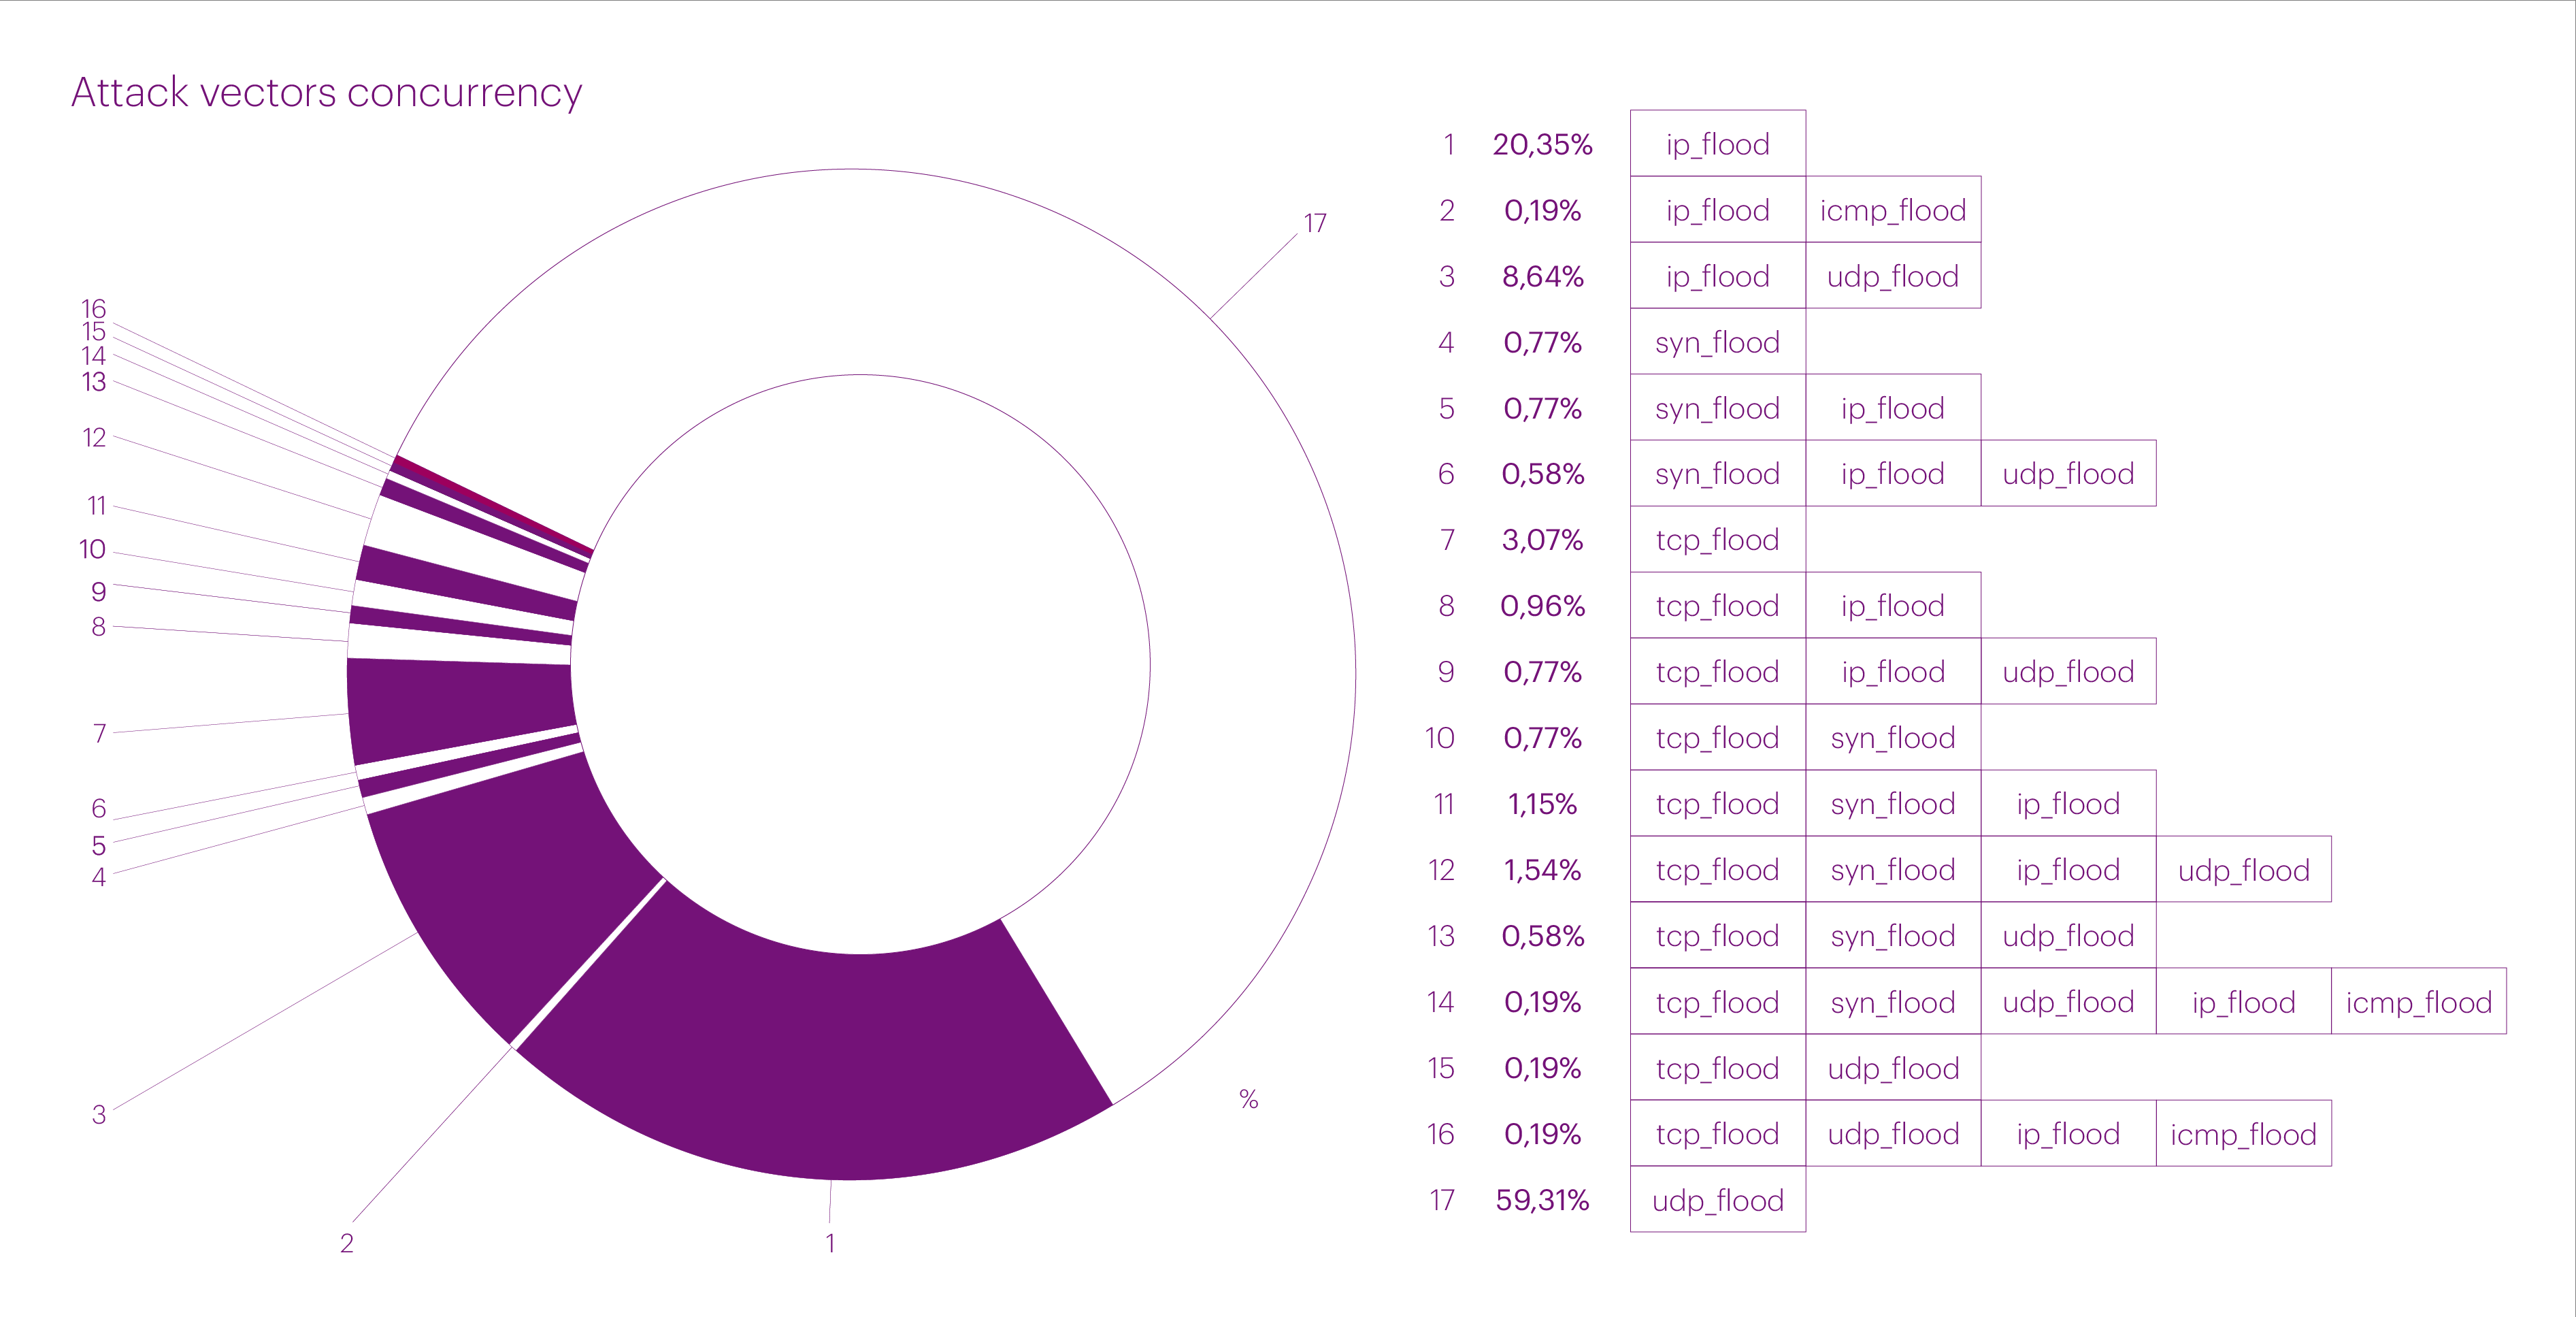
In total, multi-vector attacks accounted for 16.51% of all L3-L4 attacks in the third quarter. This represents a slight decrease compared to Q1 and Q2 of this year. Nevertheless, the number of such attacks remains higher than in 2023.
It is clear that DDoS attackers have recognized the effectiveness of multi-vector attacks, especially against unprotected or poorly protected infrastructures, and continue to exploit their advantages.
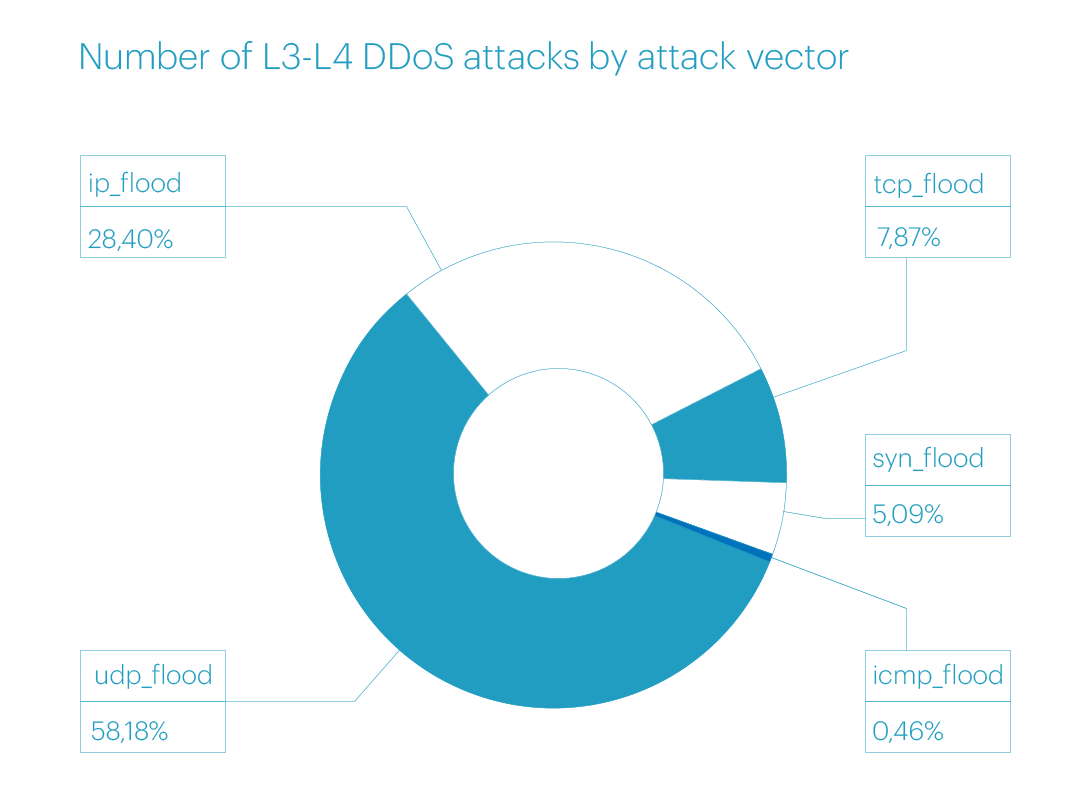
Excluding mixed vectors, the distribution of “pure” vectors in the third quarter of 2024 was as follows:
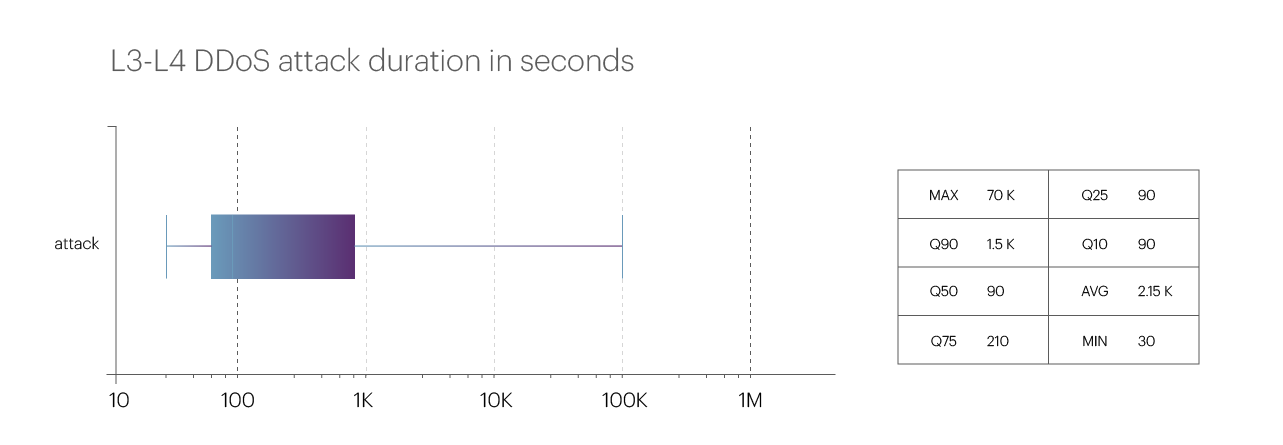
In terms of attack duration, the third quarter of 2023 did not set any records, especially when compared to the first quarter’s figures. The average attack duration decreased to 35.8 minutes. Excluding peak values (90th percentile), the duration of attacks was 25 minutes — significantly longer than in the previous reporting period (around 15 minutes), but still not particularly long.
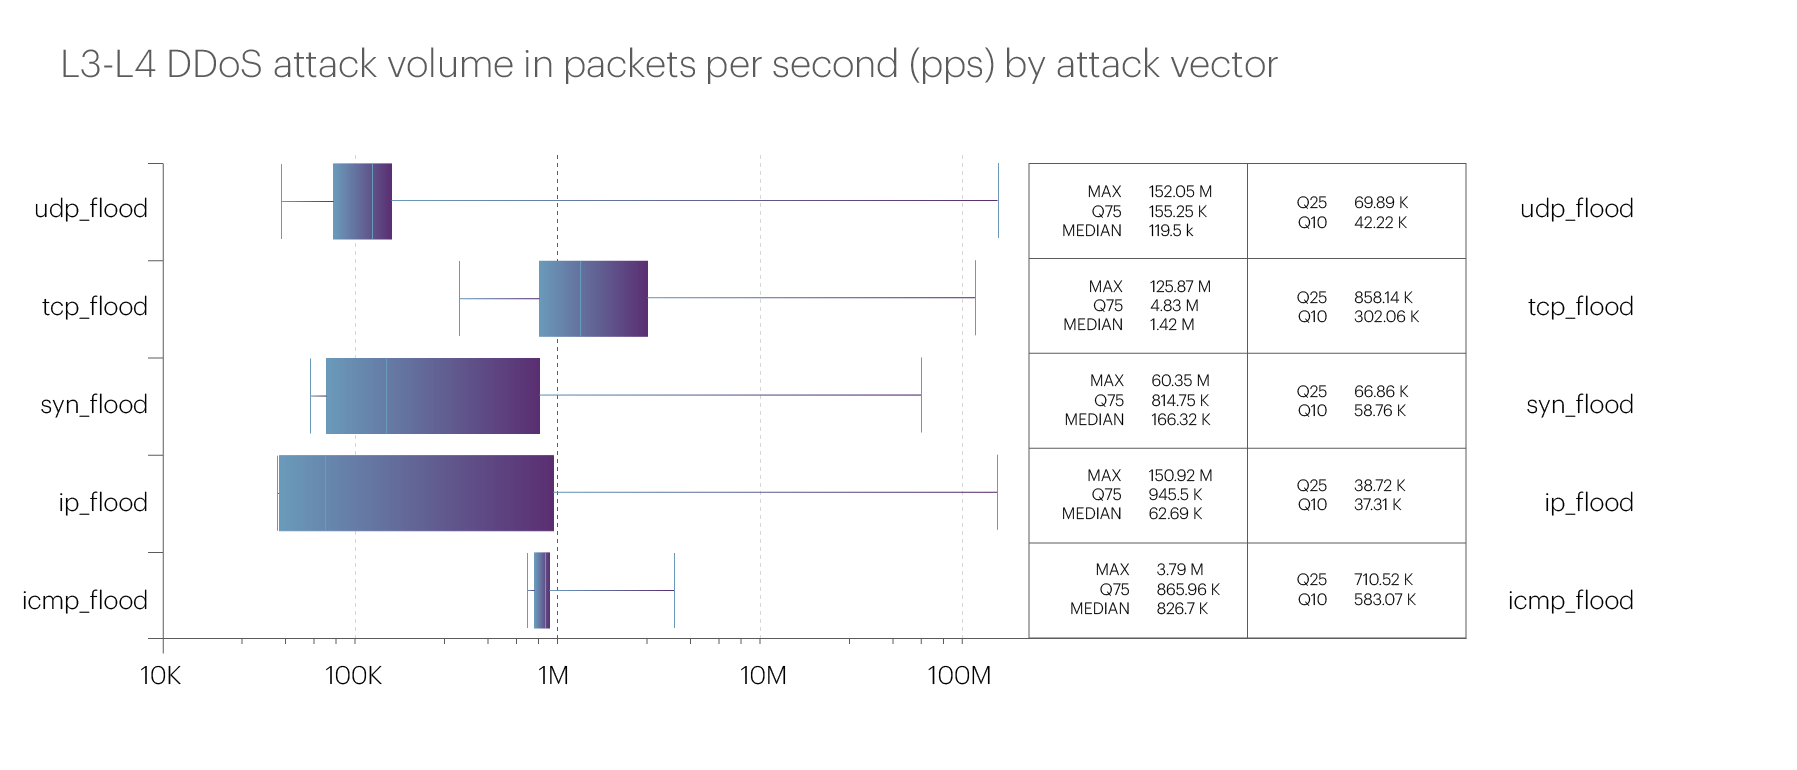
The intensity of attacks in the third quarter of 2024 increased slightly compared to the previous quarter. The most powerful attack was once again recorded in the Betting shops microsegment. It was a UDP flood with a bitrate of 446.57 Gbps and a packet rate of 152.05 Mpps. We attribute the increased activity in this segment to major sporting events that took place over the summer, including the UEFA European Championship and the Summer Olympics.
The detailed statistics for the maximum attack bitrate across different vectors are as follows:
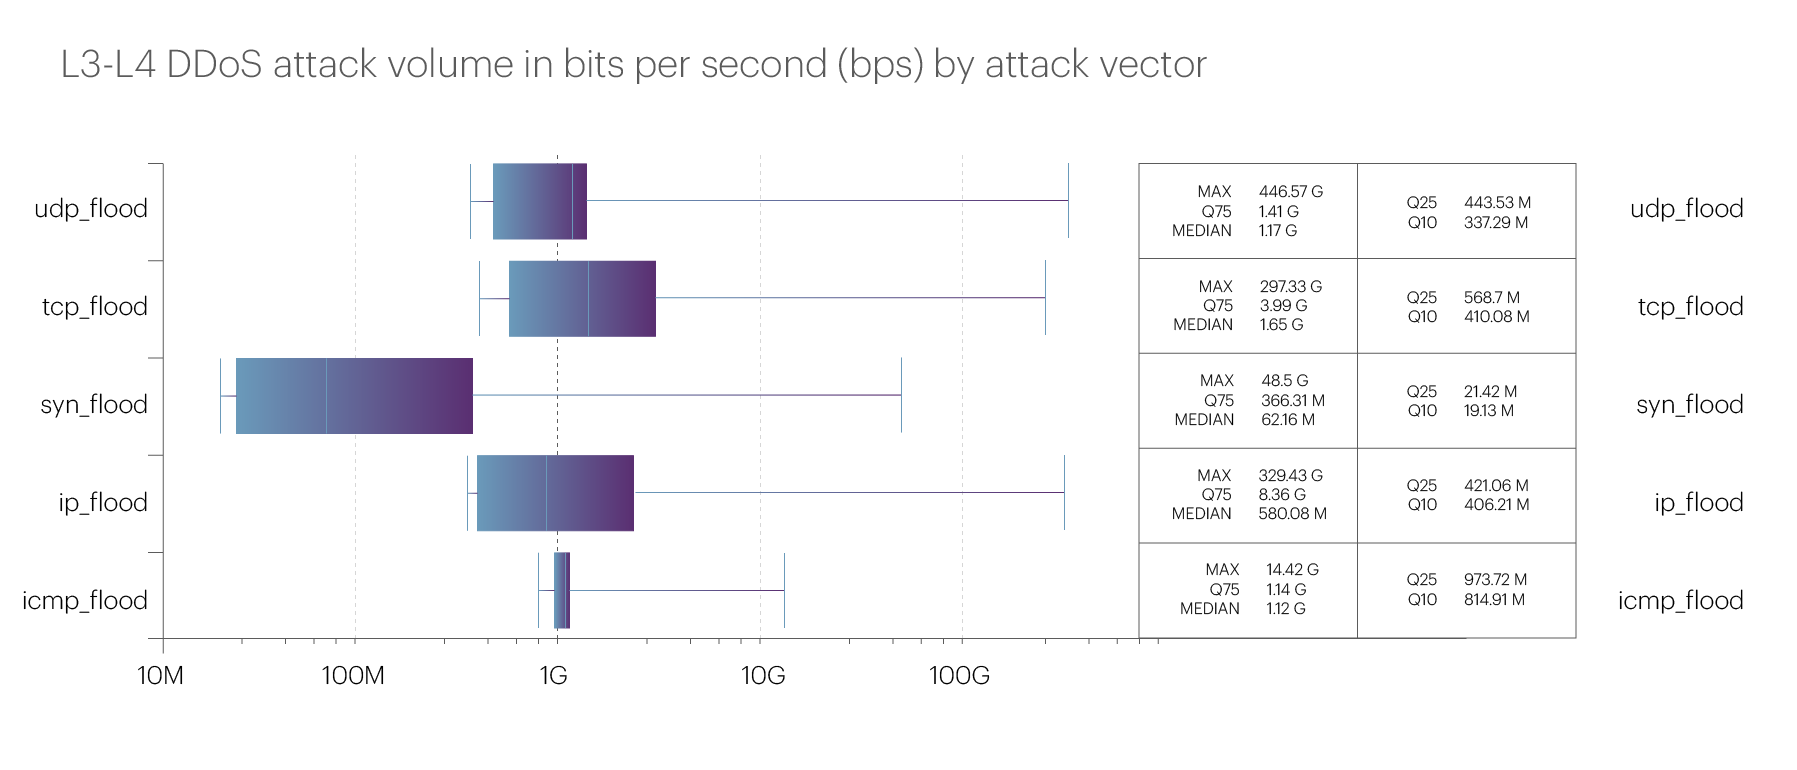
However, this is still well below the records of previous years. Let us remind you that in 2022 and 2023, the third quarters were typically characterized by significantly higher peak intensities of L3-L4 attacks.
The maximum attack intensity by packet rate increased significantly in the third quarter after the slowdown in the second quarter:
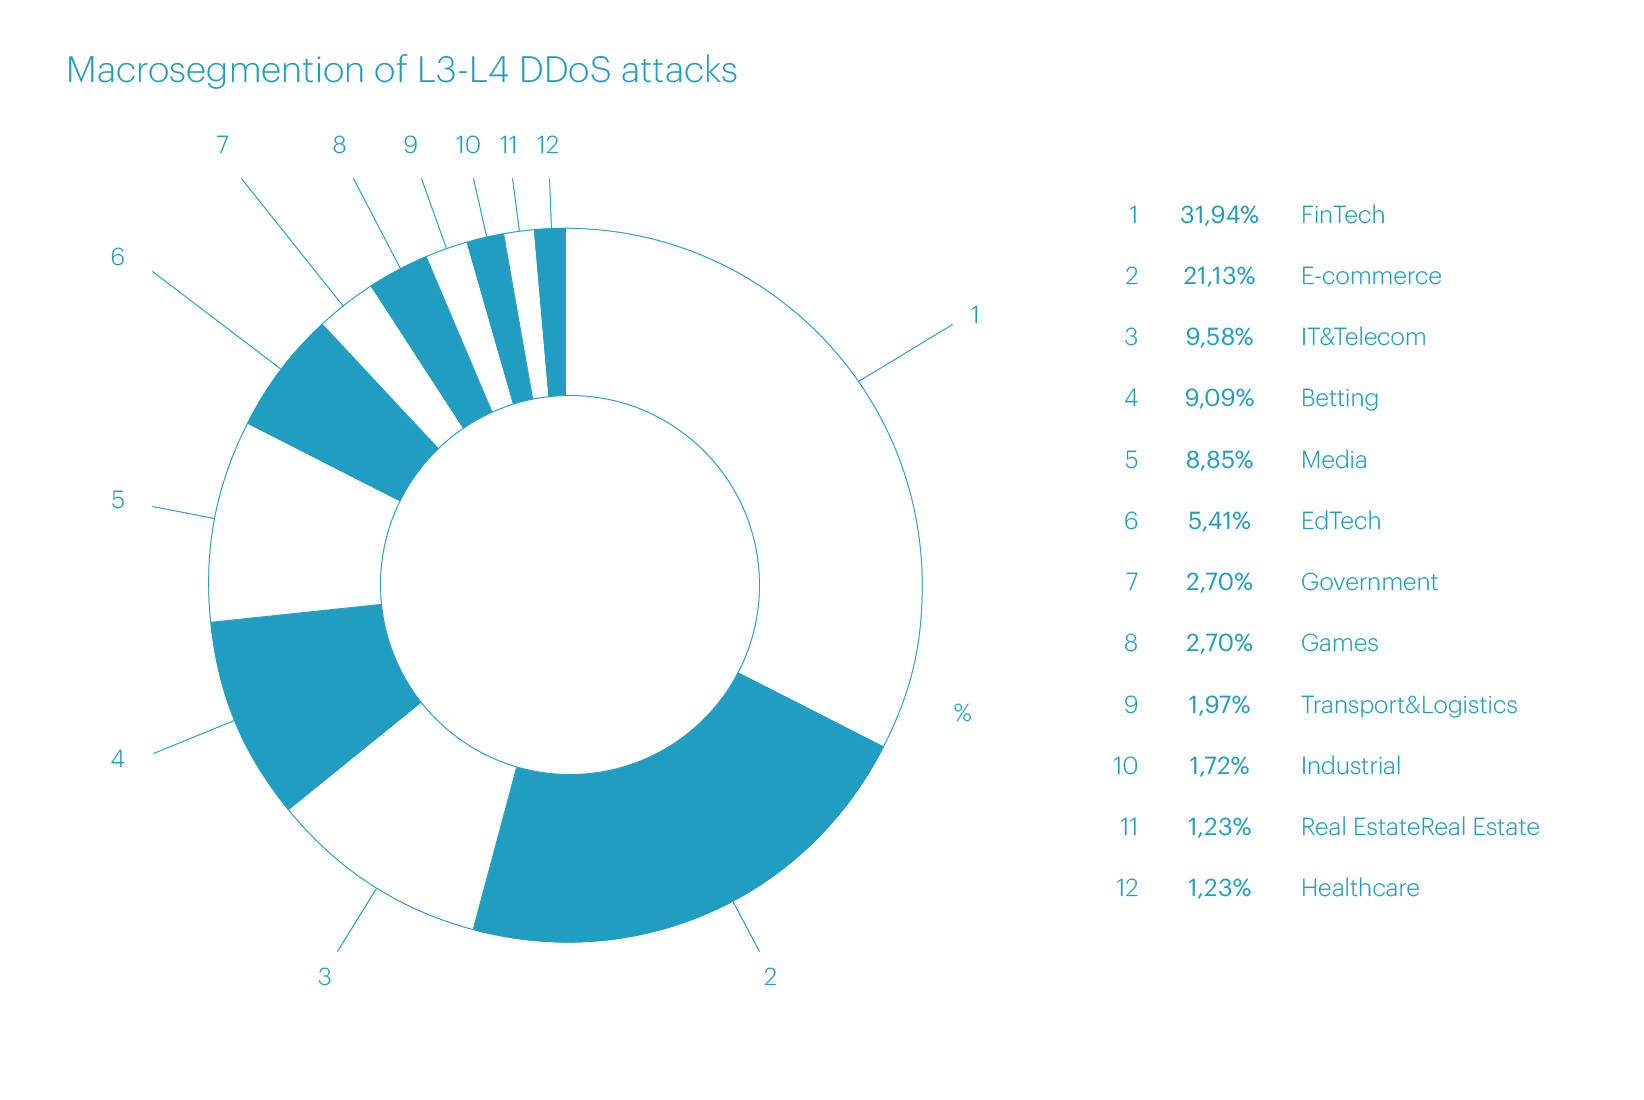
In the third quarter of 2024, attacks were predominantly focused on the macrosegments FinTech (31.94%), E-commerce (21.13%), and IT&Telecom (9.58%), similar to the previous reporting period.
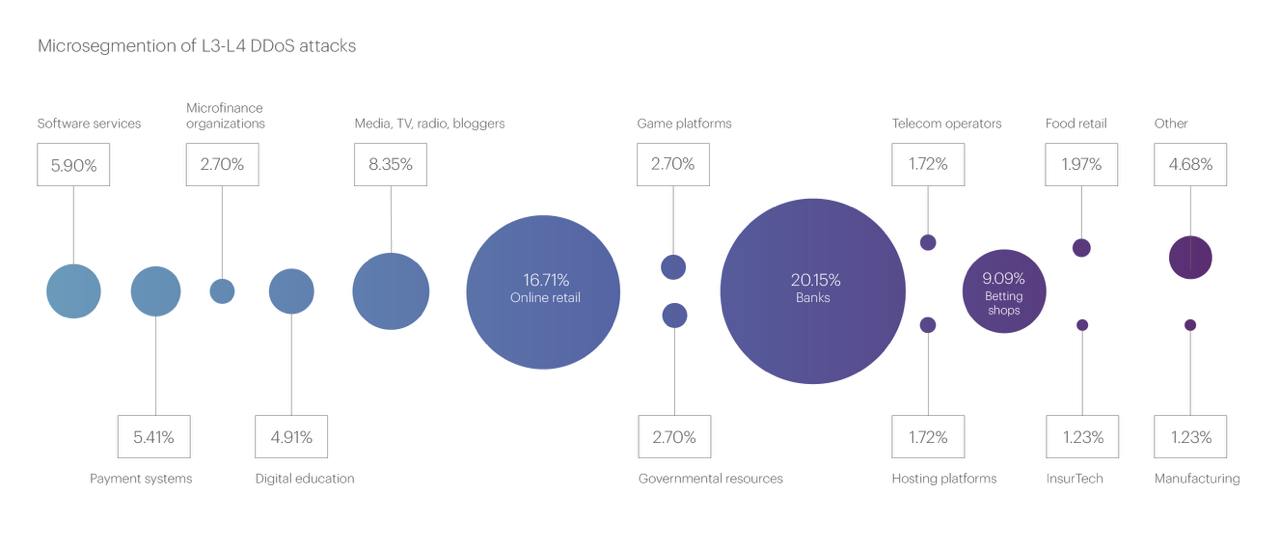
The top three most targeted microsegments remained the same, but there were some shifts in rankings: Banks surged to first place with 20.15% of all attacks, Online retail took second place with 16.71%, while the Betting shops segment, which held first place last quarter, dropped to third with 9.09%.
The longest L3-L4 attack this quarter targeted the FinTech macrosegment, specifically the Banks microsegment, and continued for 19.45 hours.It was a UDP flood with a peak bitrate of around 316 Gbps. In second place is an attack on the Betting shops microsegment, which lasted 1.96 hours. Third place goes to an attack on the Online travel agencies microsegment, which ran for 1.67 hours.
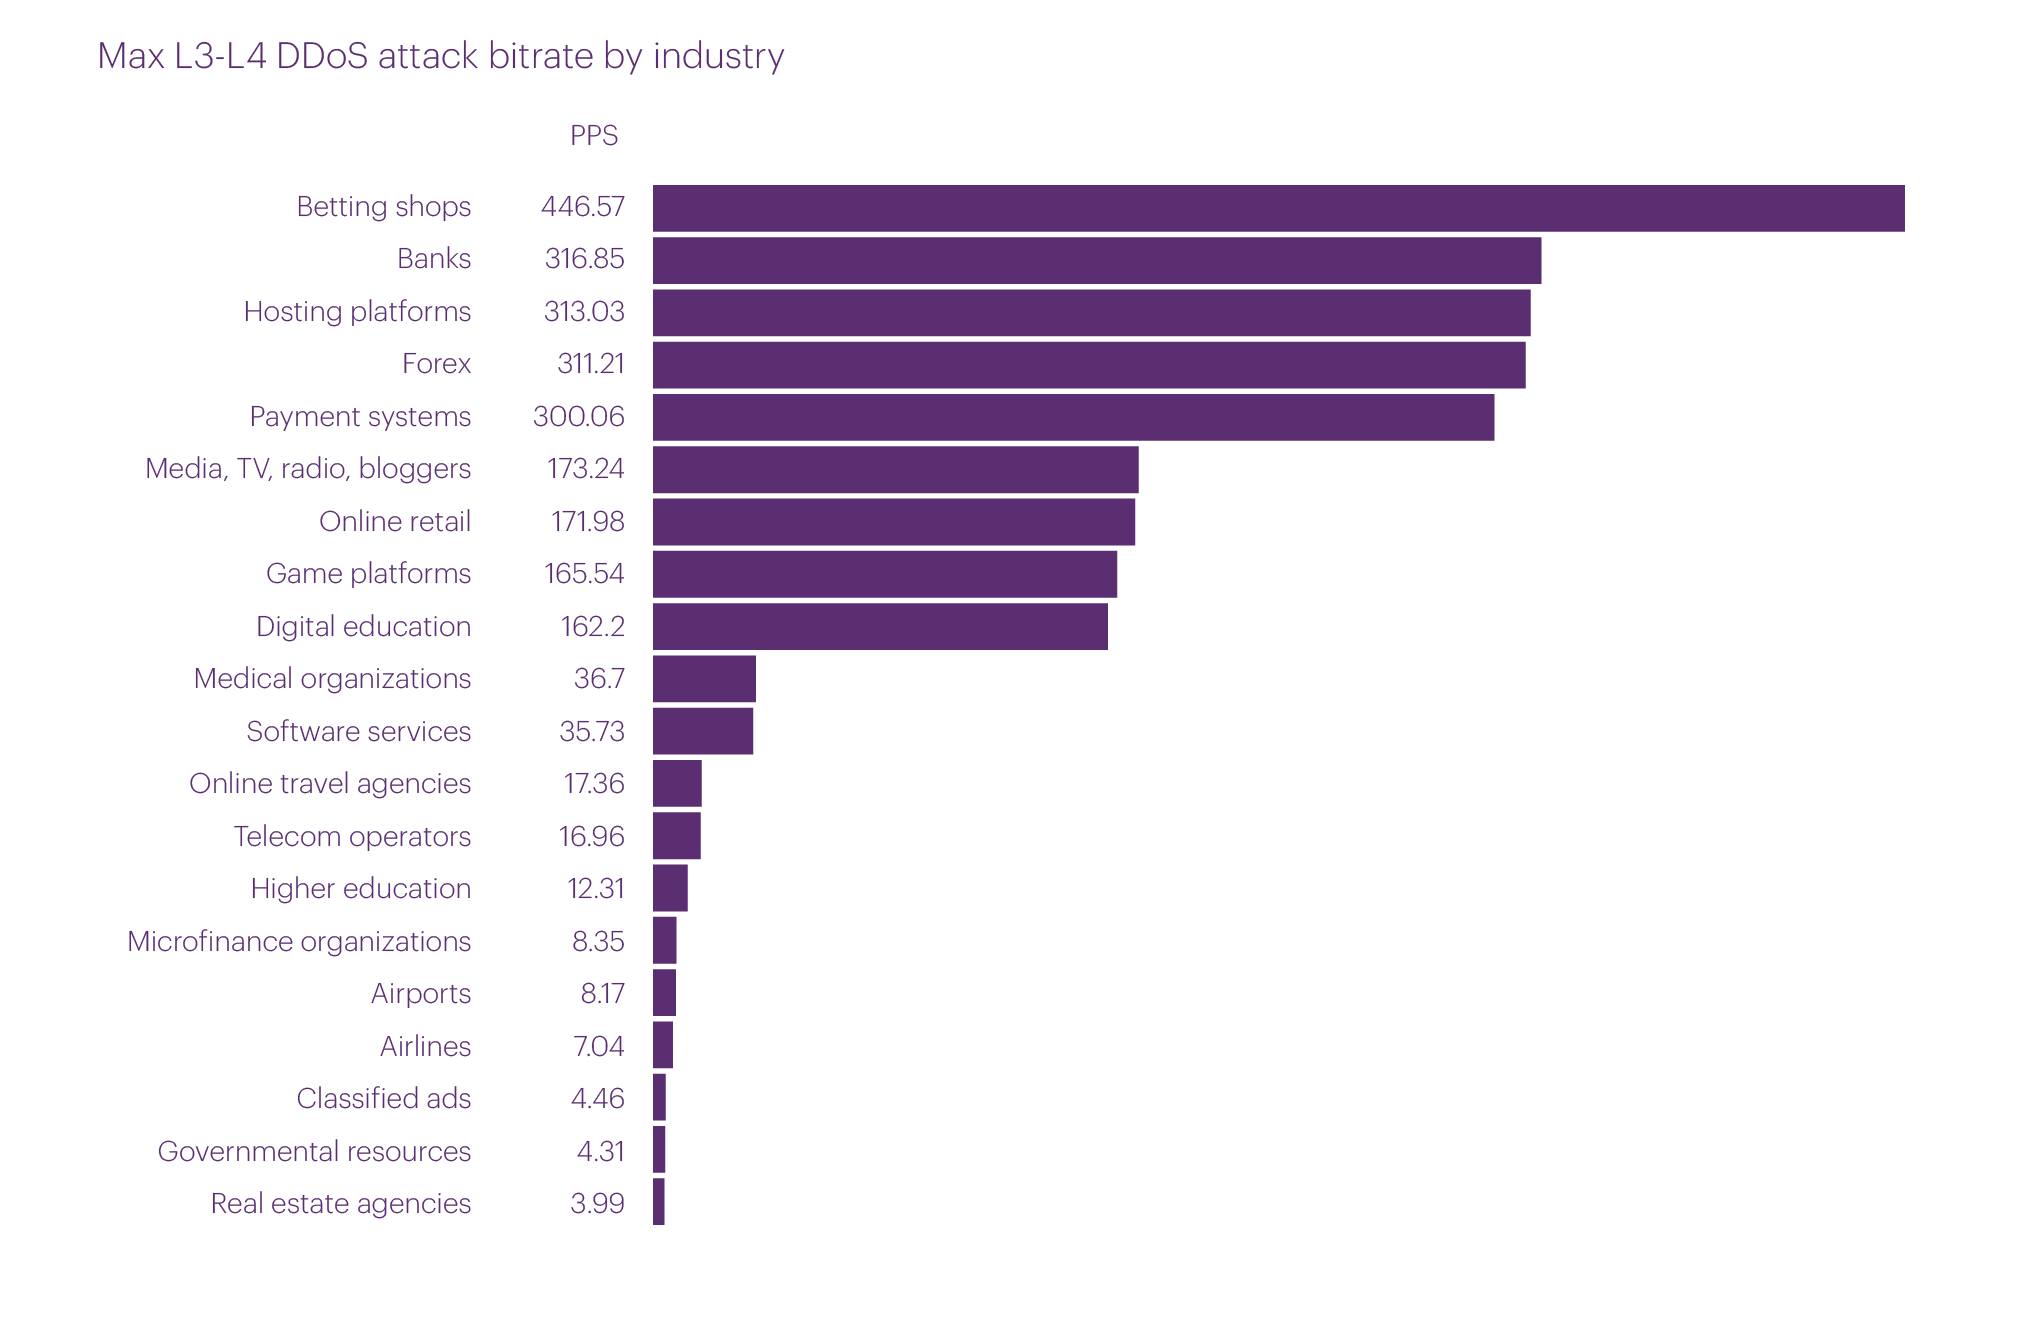
The most powerful L3-L4 attacks in the third quarter of 2024 were observed in the microsegments Betting shops (446.57 Gbps), Banks (316.85 Gbps), Hosting platforms (313.03 Gbps), Forex (311.21 Gbps), and Payment systems (300.06 Gbps). As in the previous quarter, we recorded a significant number of attacks with a bitrate exceeding 100 Gbps. In addition to the five mentioned above, such attacks also targeted the microsegments Media, Online retail, Game platforms, and Digital education.
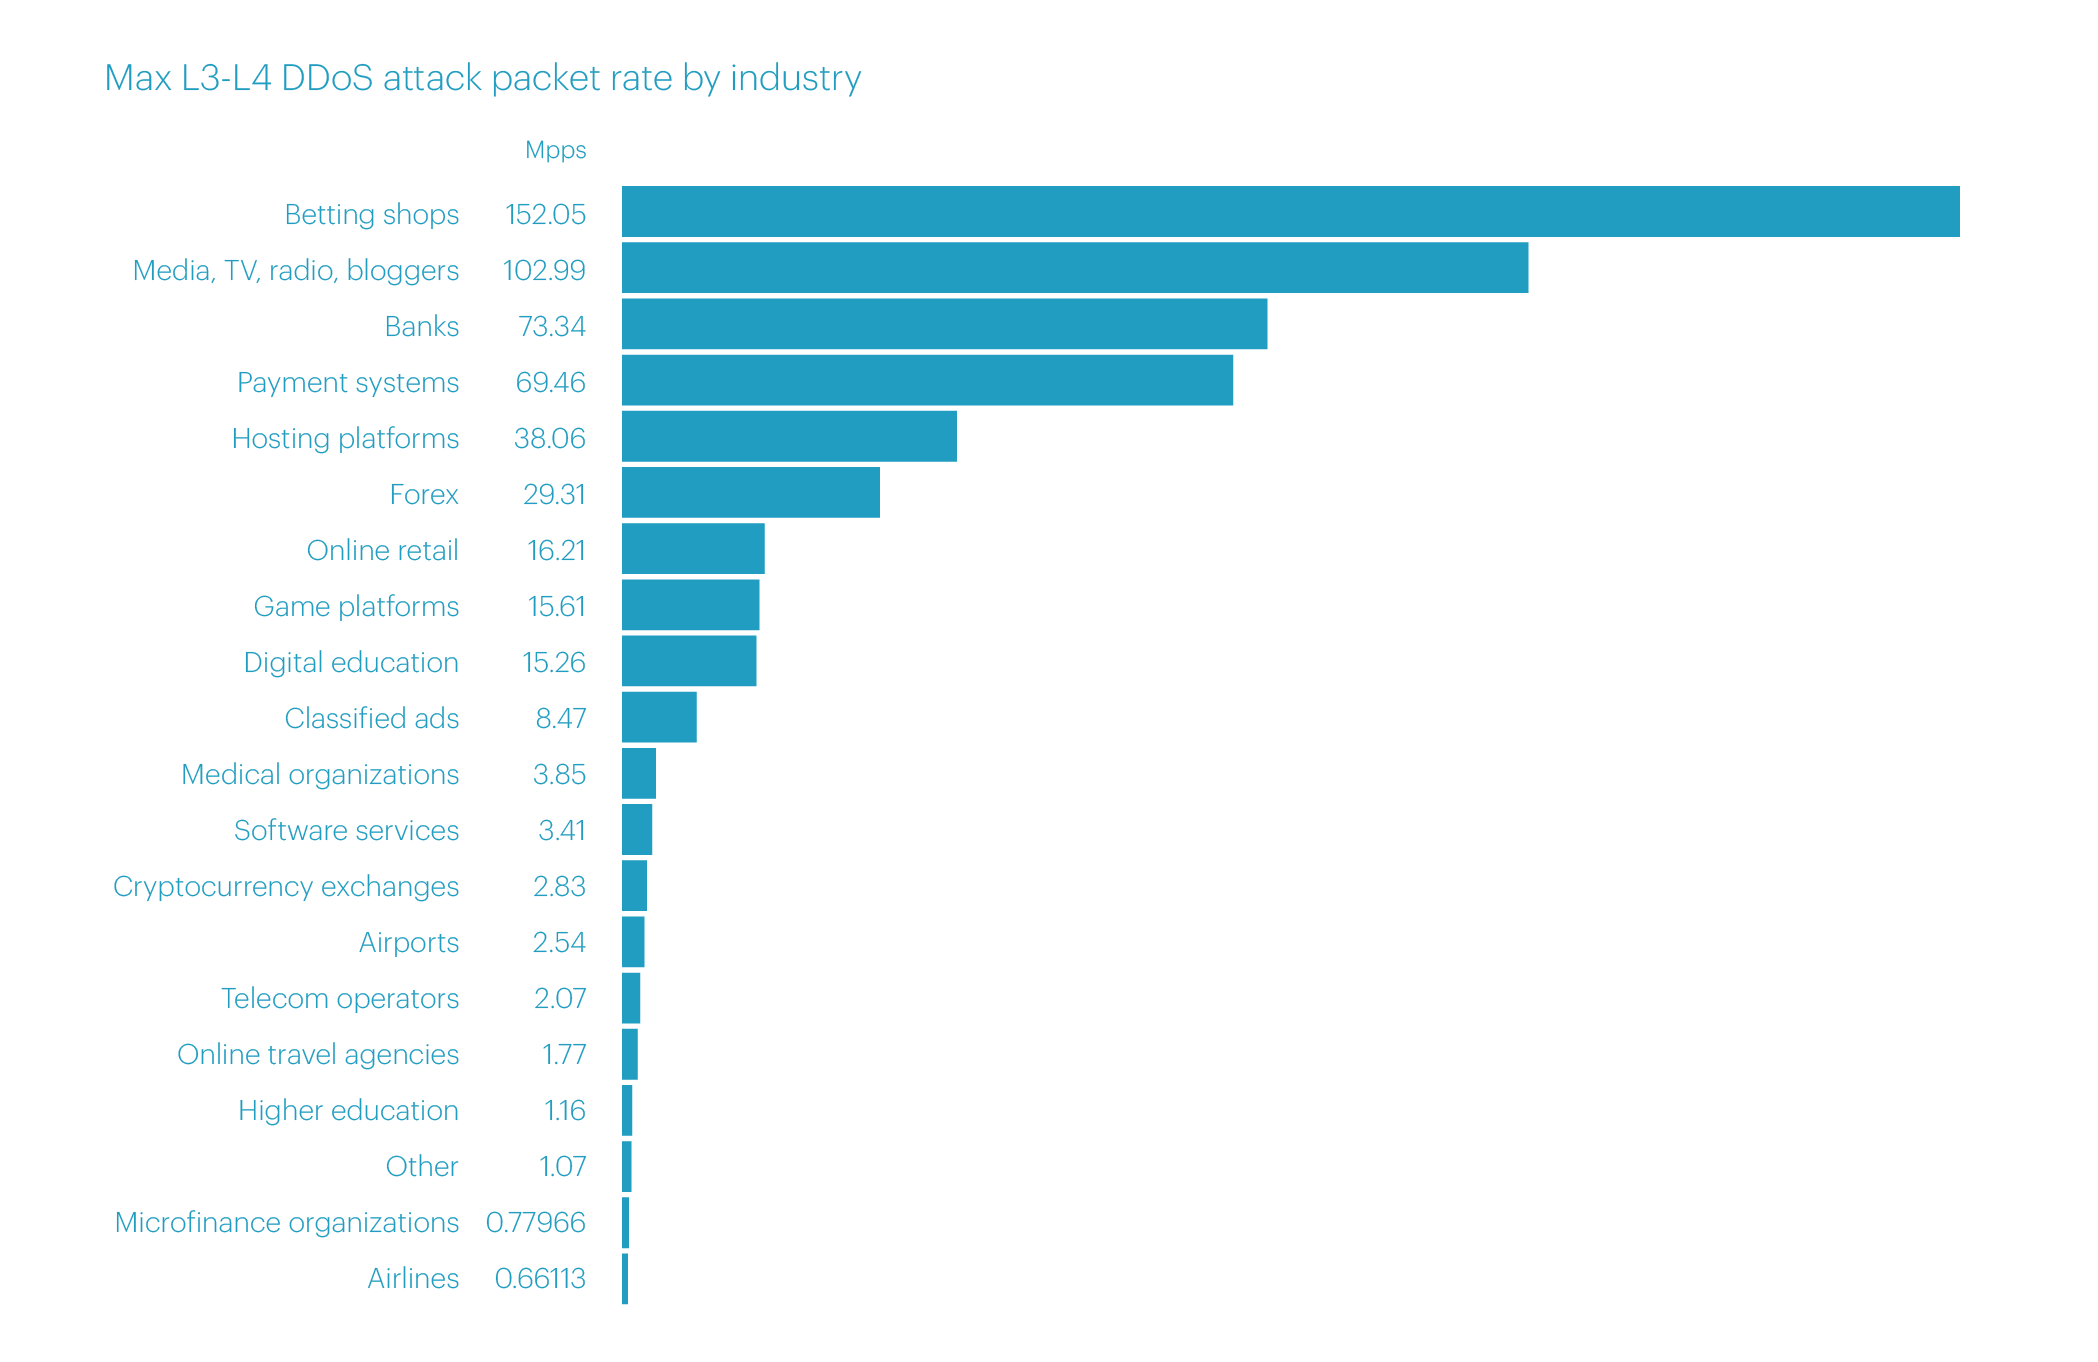
The top five microsegments targeted by the most intense attacks in terms of packet rate include mostly the same industries, but the order is somewhat different. In first place, by a significant margin, is the Betting shops microsegment (152.05 Mpps). In second place is the Media, TV, radio, bloggers (102.99 Mpps), followed by Banks (73.34 Mpps), Payment systems (69.46 Mpps), and Hosting platforms (38.06 Mpps).
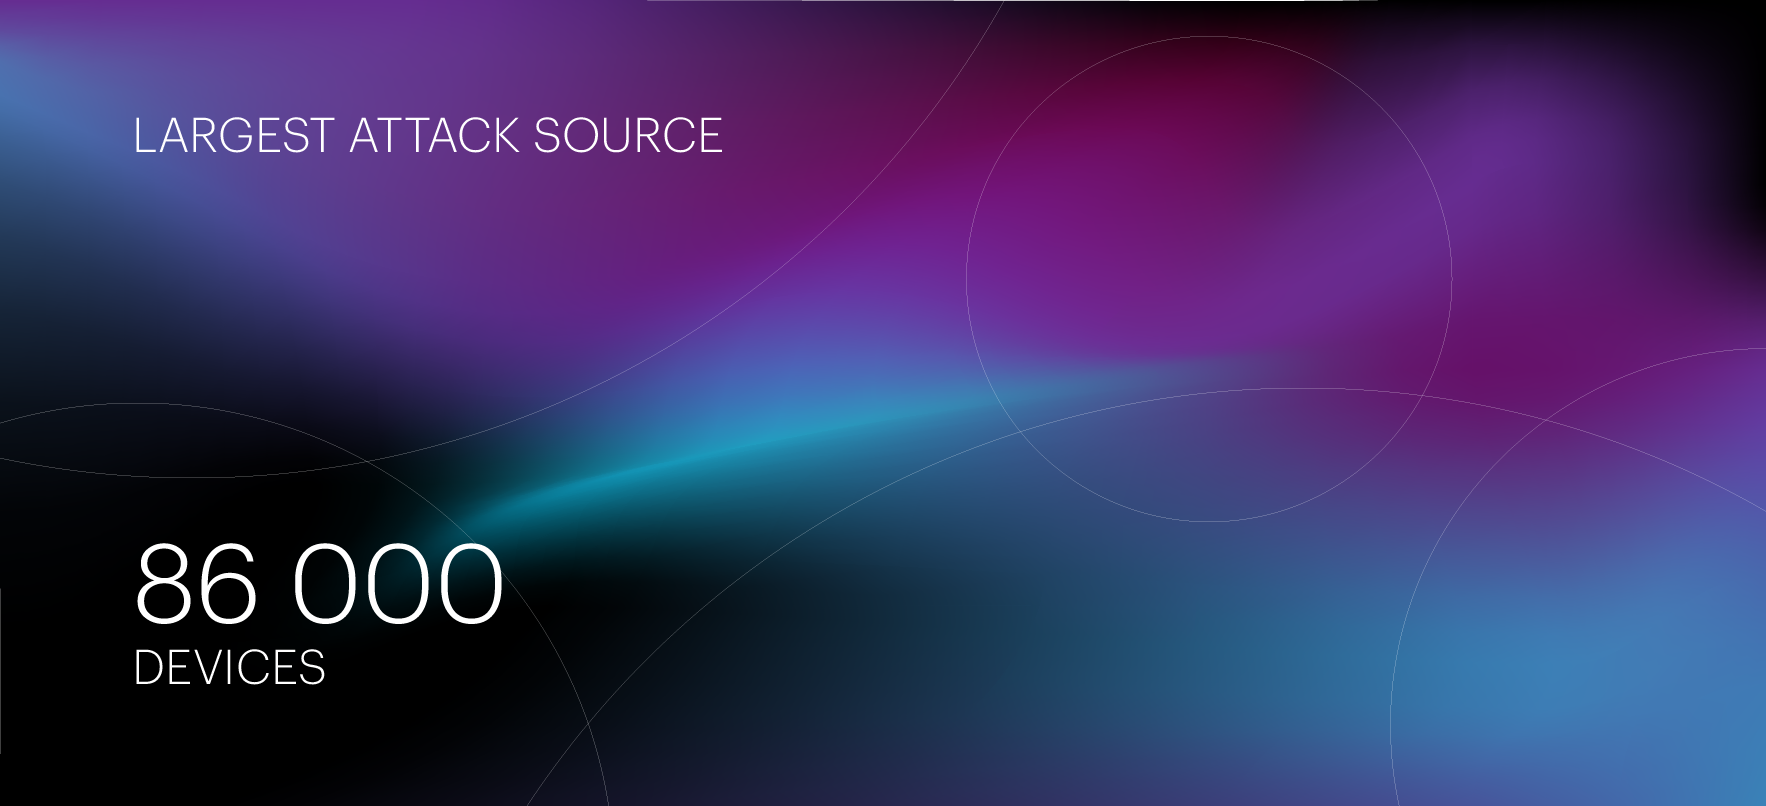
The largest botnet of the third quarter was discovered during an attack on August 18 targeting an organization in the E-commerce segment, Services microsegment. Devices that were part of this botnet were detected in the USA, the UK, Hong Kong, Germany, the Seychelles, and Brazil.
This botnet consisted of 86,000 bots, making it the largest we’ve seen so far this year. For comparison, the record botnet in Q1 consisted of 51,400 bots, and in Q2 — 60,500.
The number of application layer attacks, like the number of L3-L4 attacks, increased significantly compared to the previous quarter (+70%). As mentioned earlier, we attribute this to seasonality — attackers are gradually ramping up their activity, with the peak typically occurring around the holiday shopping season.
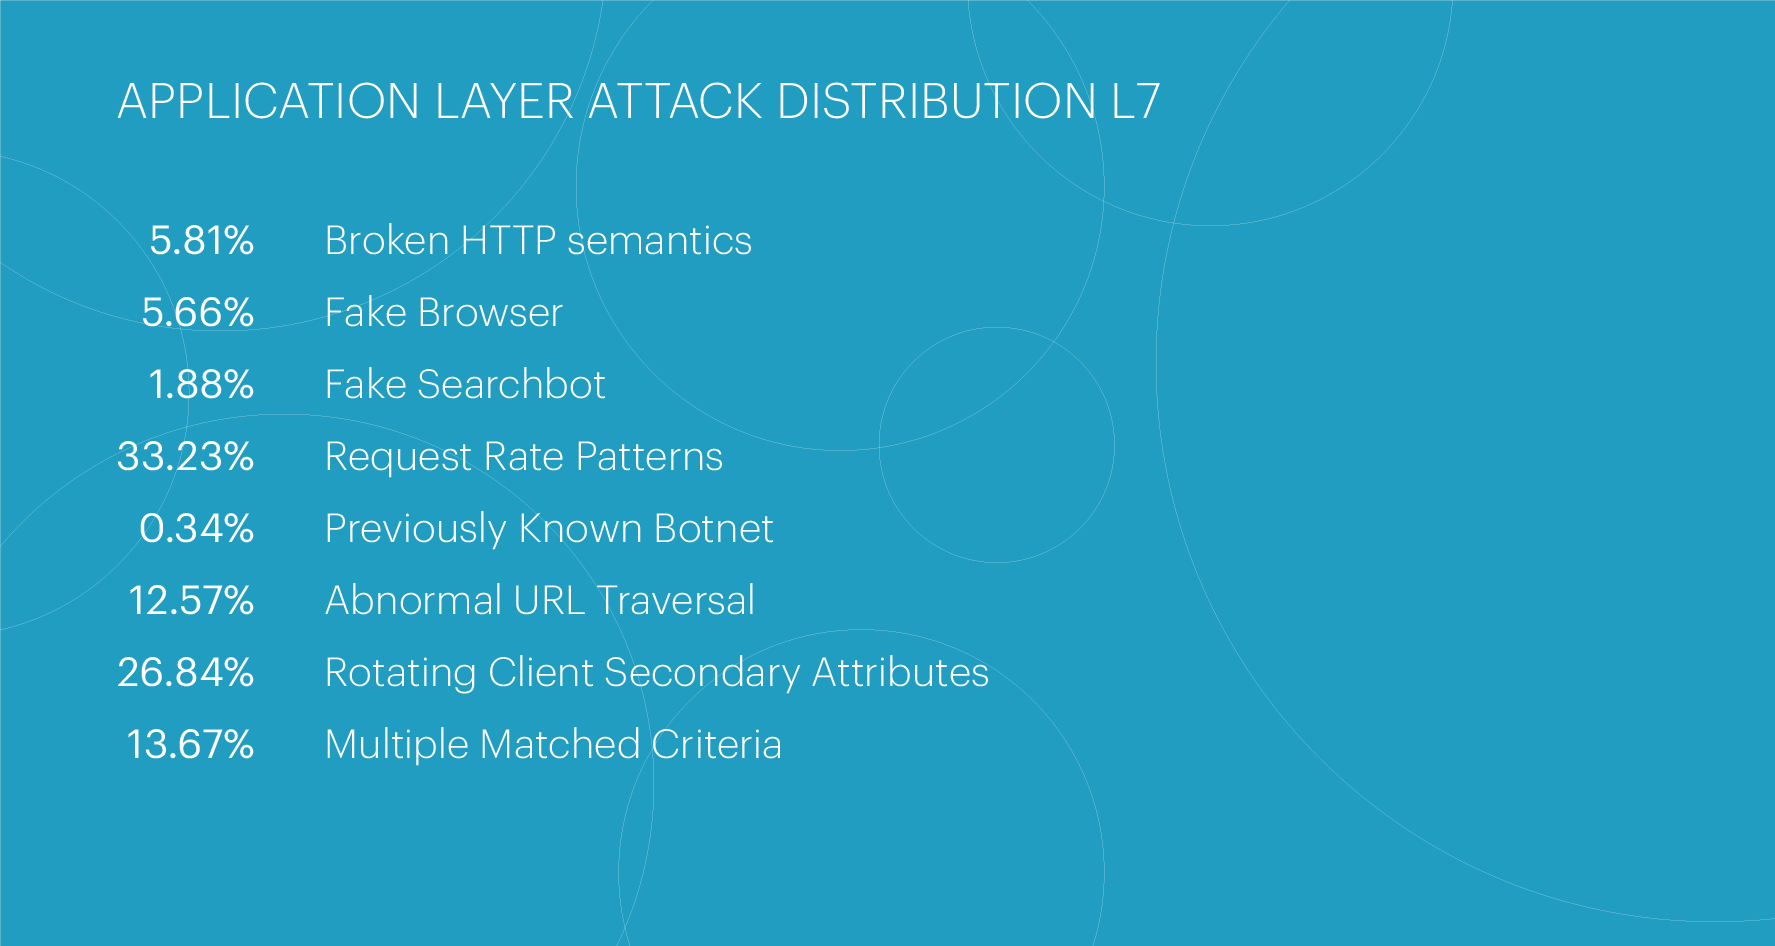
The top three most common attack classes have remained unchanged for the fifth consecutive quarter. The largest share is held by the Request Rate Patterns class (33.23%), characterized by request frequencies that deviate from expected legitimate user behavior. In second place is the Rotating Client Secondary Attributes class (26.84%) — attacks featuring an unusual set of headers in the request. In third place are multi-class attacks, the Multiple Matching Criteria class (13.67%).
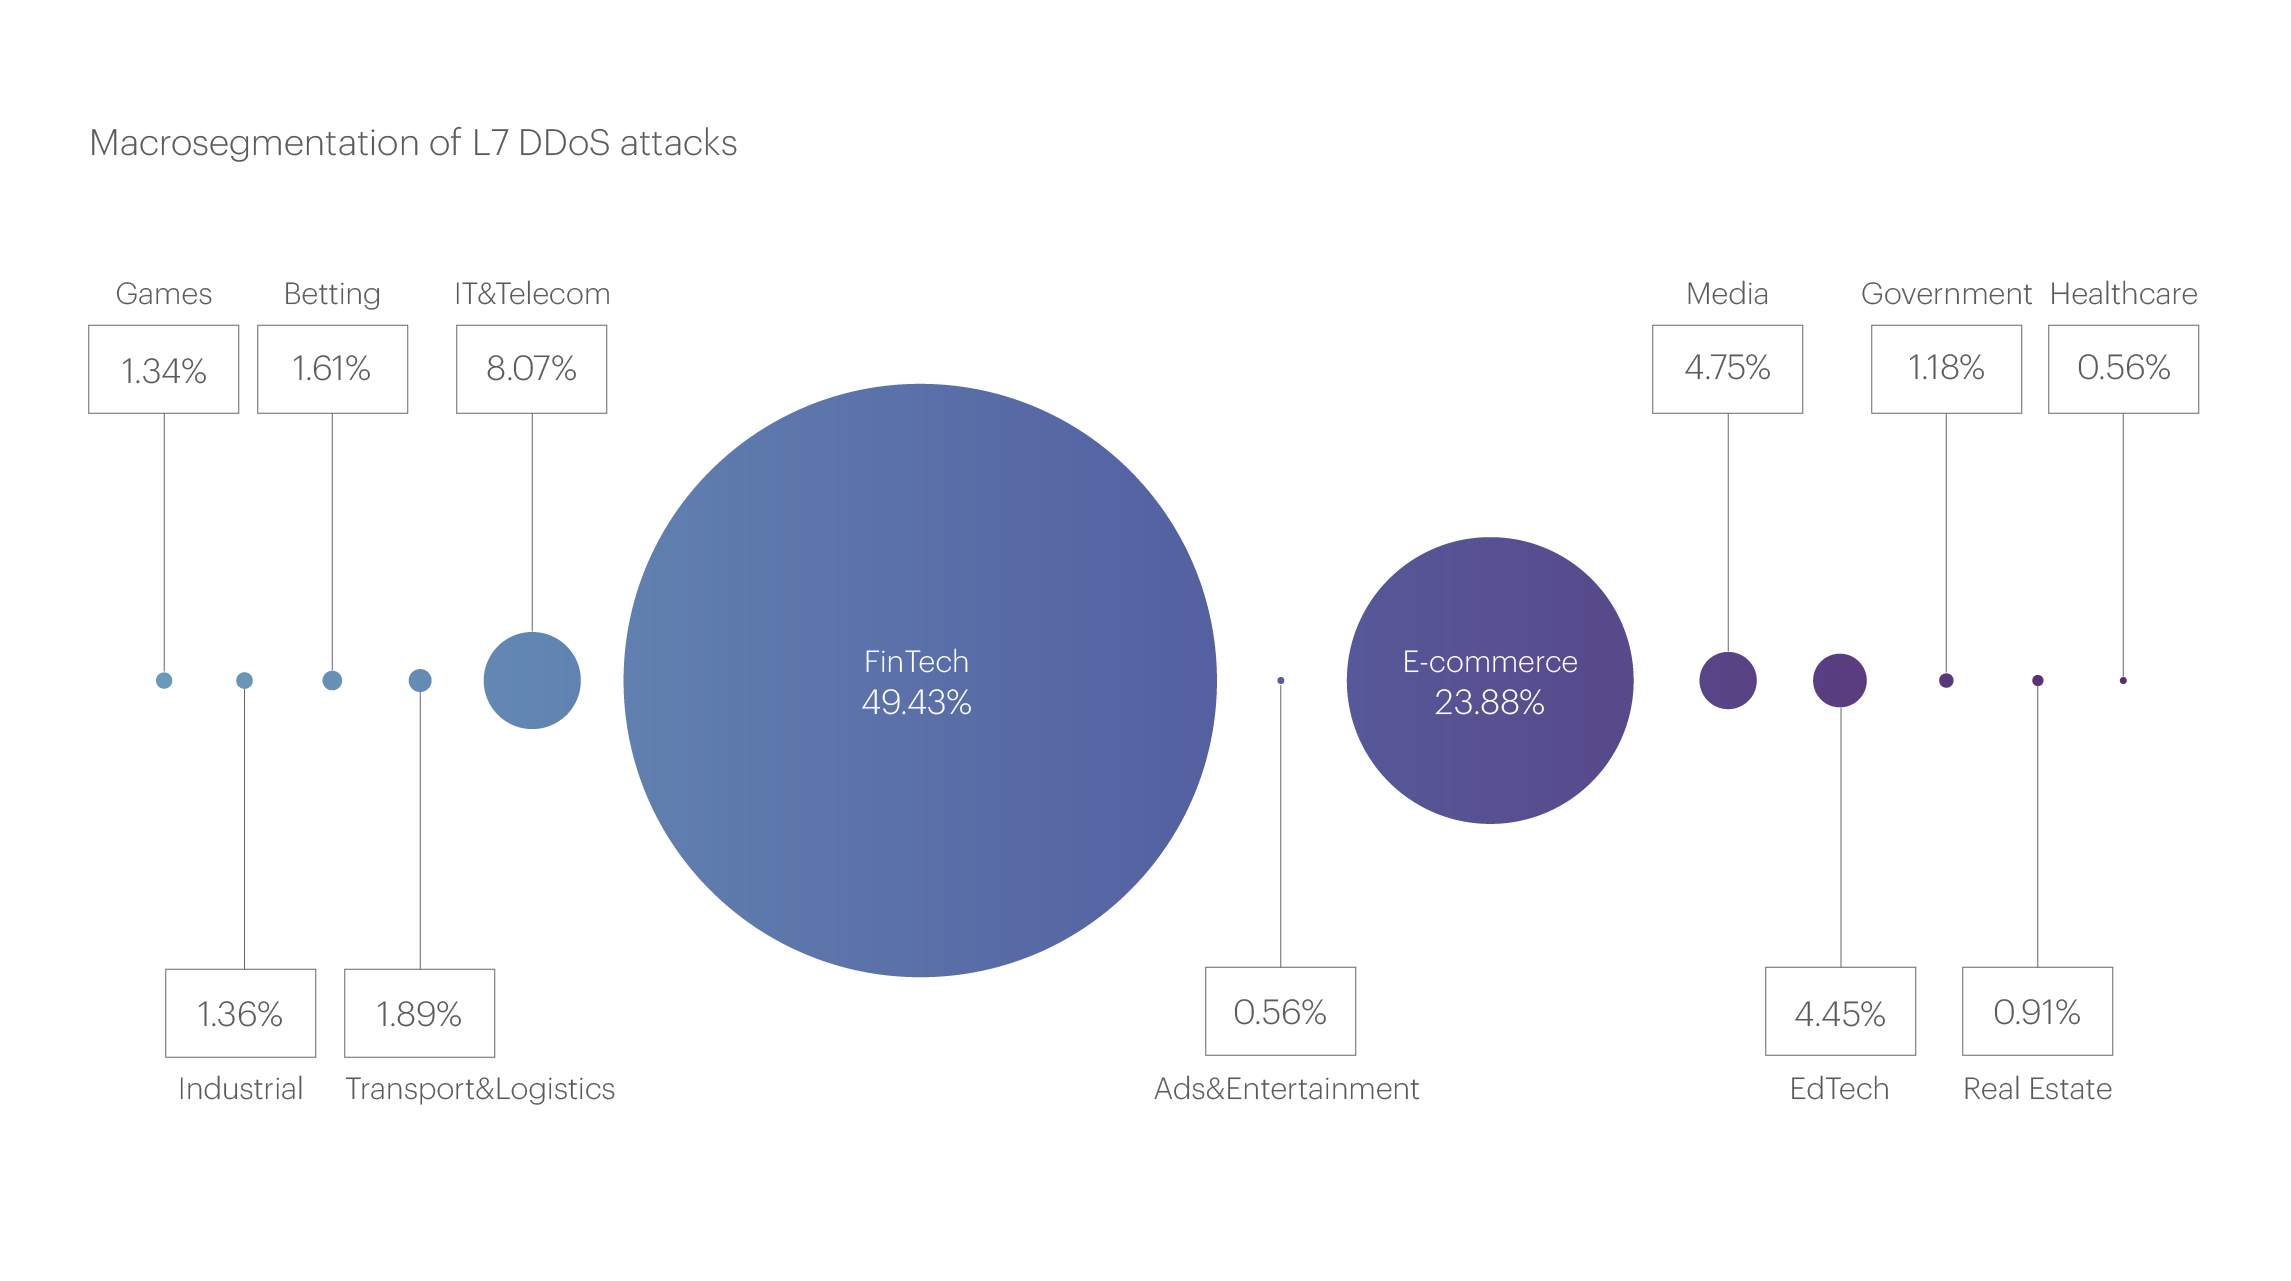
The largest number of L7 attacks in Q3 targeted the FinTech macrosegment. After five quarters of steady growth, its share in this reporting period slightly decreased — from 56.8% to 49.43%. Nevertheless, this segment still accounts for nearly half of all application layer attacks.
Second place in the number of L7 attacks, as before, is held by the E-commerce macrosegment, whose share, on the contrary, significantly increased compared to the previous quarter, from 13.84% to 23.88%
As for third place, it is still held by the IT&Telecom, macrosegment, whose share remains surprisingly stable, increasing ever so slightly from 7.79% of attacks in Q3 to 8.07% in Q3.
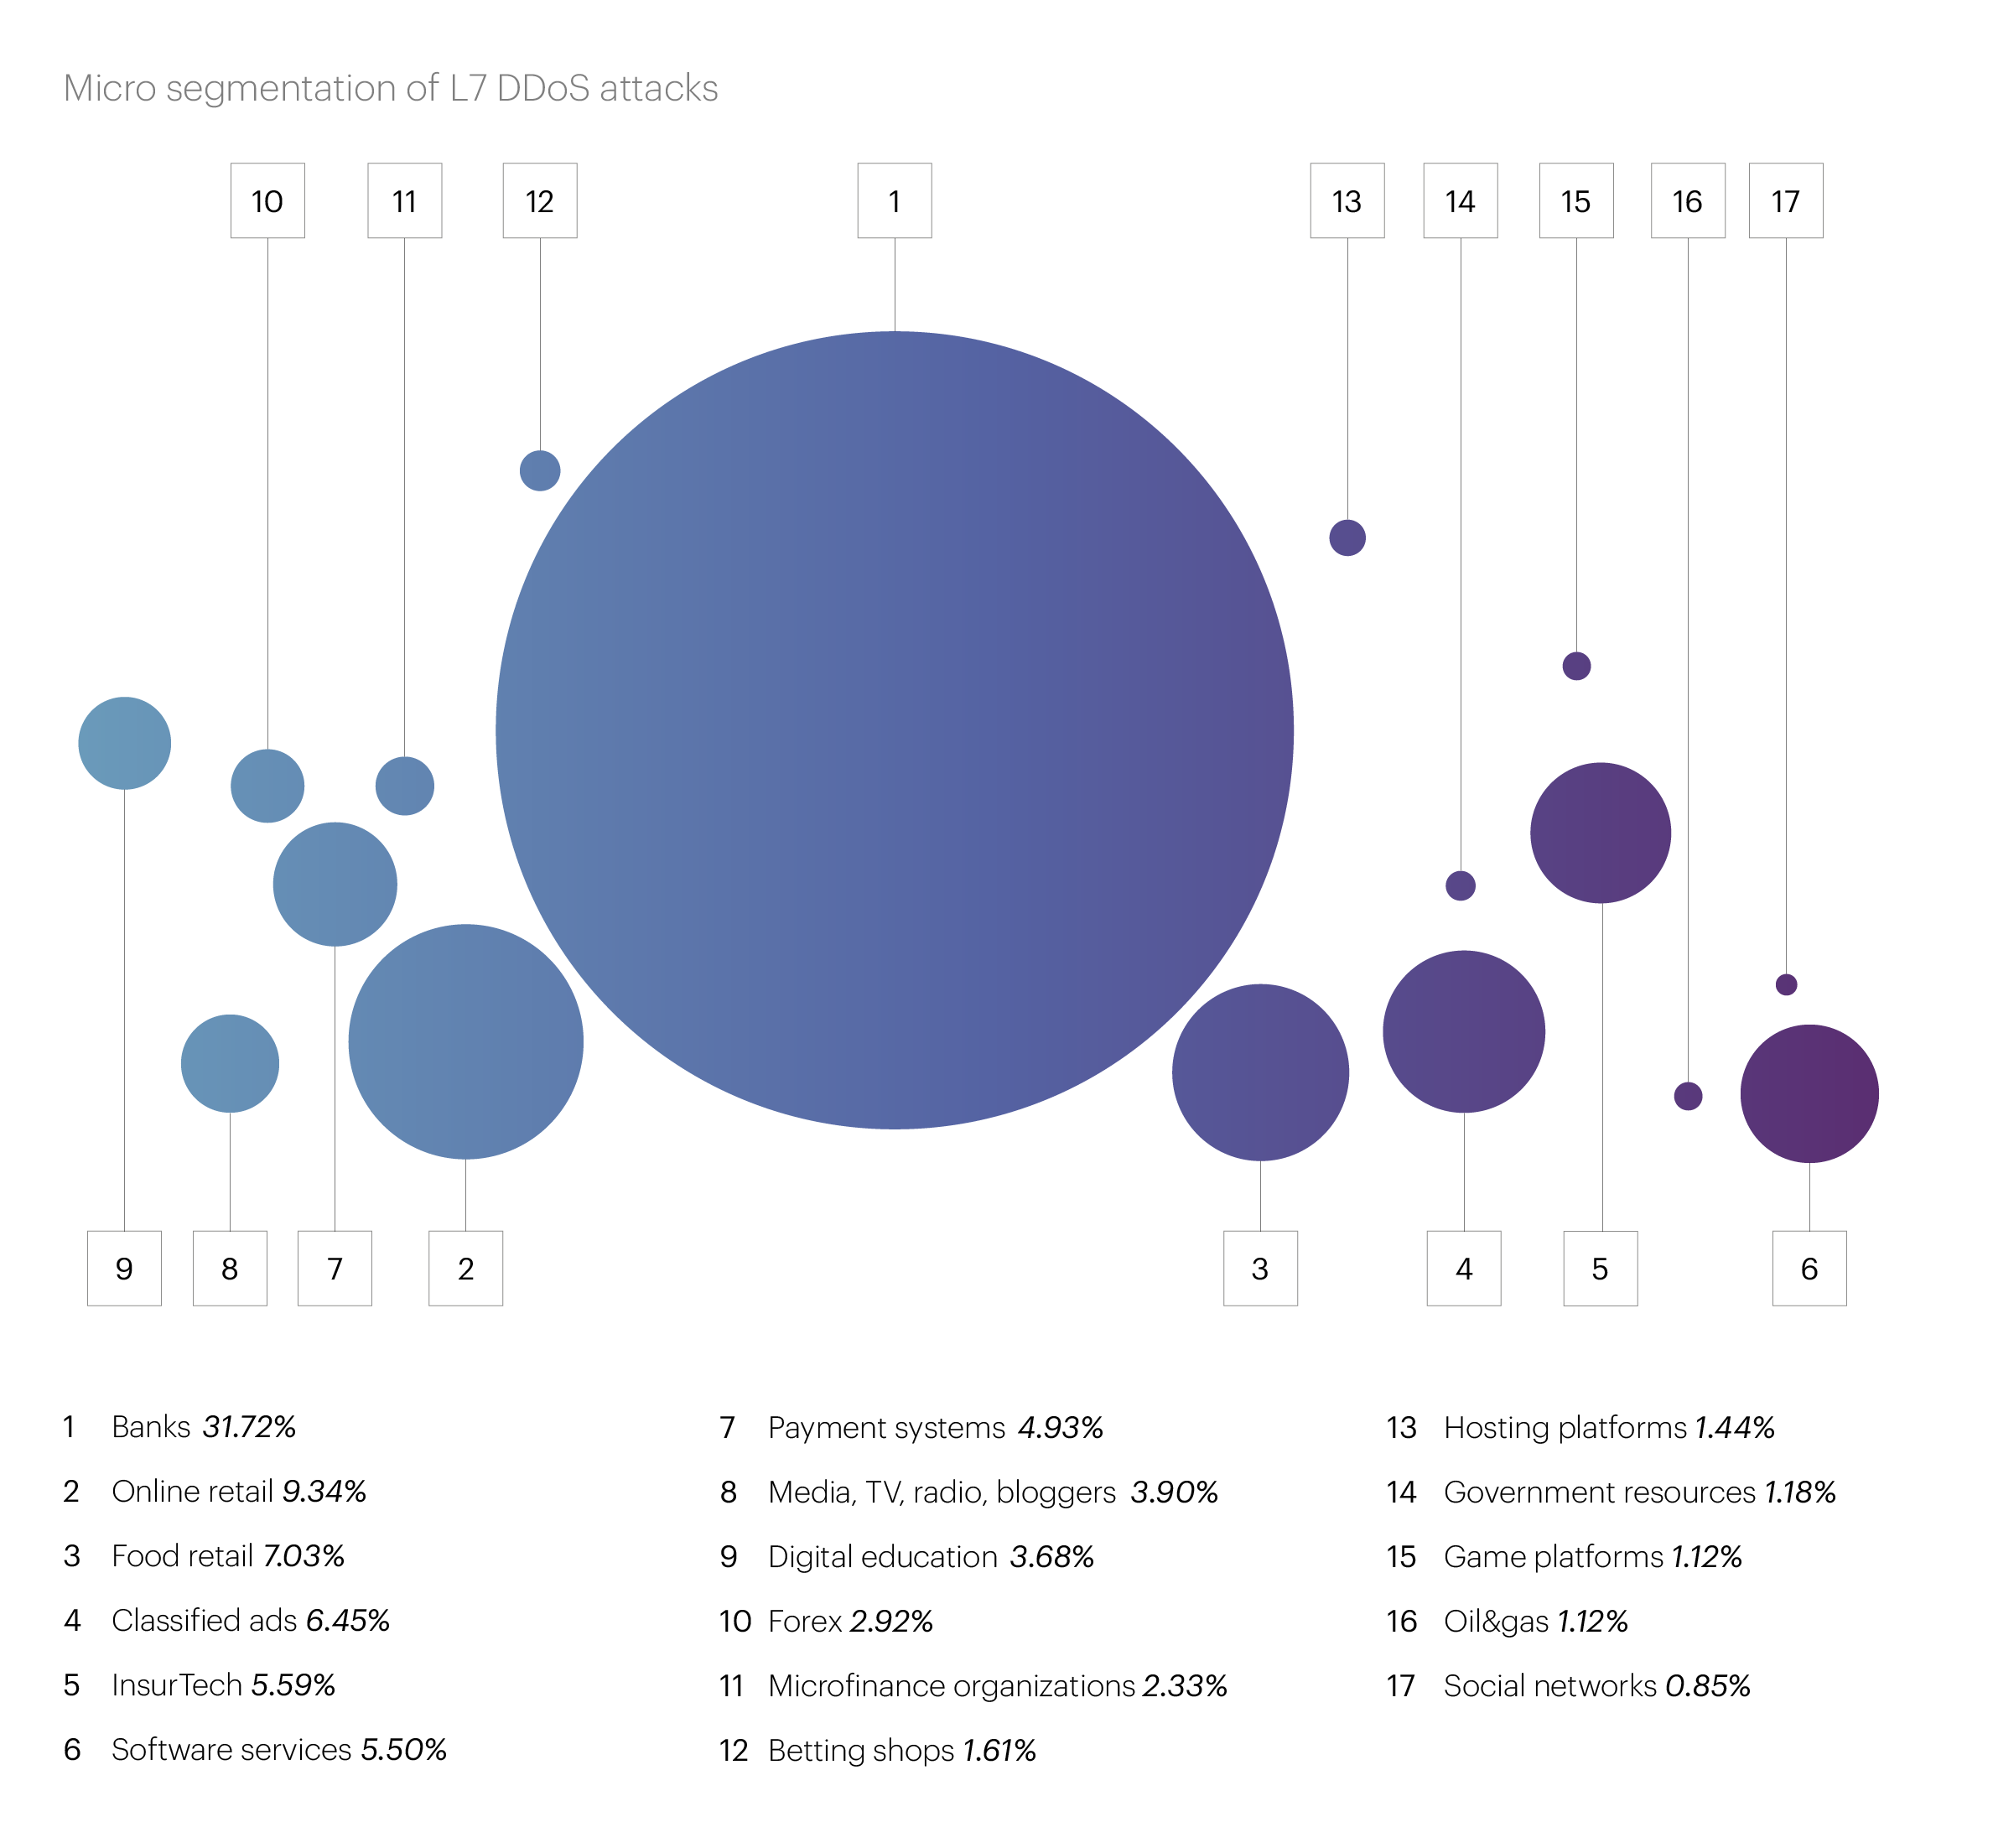
In the top five microsegments most frequently targeted by application layer attacks in the third quarter, the top two spots remained unchanged. The Banks microsegment leads by a large margin (31.72%), with Online retail in second place (9.34%). They are followed by Food retail (7.03%), Classified ads (6.45%), and InsurTech (5.59%).
In the third quarter, the overall situation with L7 attacks reversed compared to Q2: while the number of application layer attacks surged, their intensity and duration decreased, presenting a contrast to the previous quarter.
In particular, Q2 saw two attacks that lasted more than two days. However, in Q3, the longest attack barely exceeded one day (27.18 hours). The second and third longest attacks lasted 18.6 hours and 16.15 hours, respectively.
The intensity of attacks showed a similar pattern: none of the L7 attacks in the third quarter surpassed the one million rps mark. The most powerful attack (0.95 million rps at its peak) targeted the Classified ads microsegment and lasted only one minute.
Two more powerful attacks were recorded in the Betting shops microsegment. The first reached a peak of 0.49 million rps and lasted 2.5 minutes. The peak intensity of the second was 0.43 million rps with the same duration.
In total, we observed seven attacks with peak intensities exceeding 200,000 rps, in the third quarter, compared to eleven such attacks in the previous quarter.
The maximum number of devices involved in a single L7 DDoS attack in Q3 was 407,985 — this attack targeted the Telecom operators microsegment.
In the list of countries that are the main sources of malicious traffic, the top two positions have remained unchanged for many quarters. Russia still holds first place, accounting for 26.92% of all blocked IP addresses. The United States is in second place with 16.25%. As we noted in last quarter’s report, China, which typically held the third spot, saw its share drop sharply and has remained low since (2.88%).
We have not yet seen a stable contender for third place: while Brazil took “bronze” in the previous quarter, in the third quarter it was replaced by India, with a share of 4.76%.
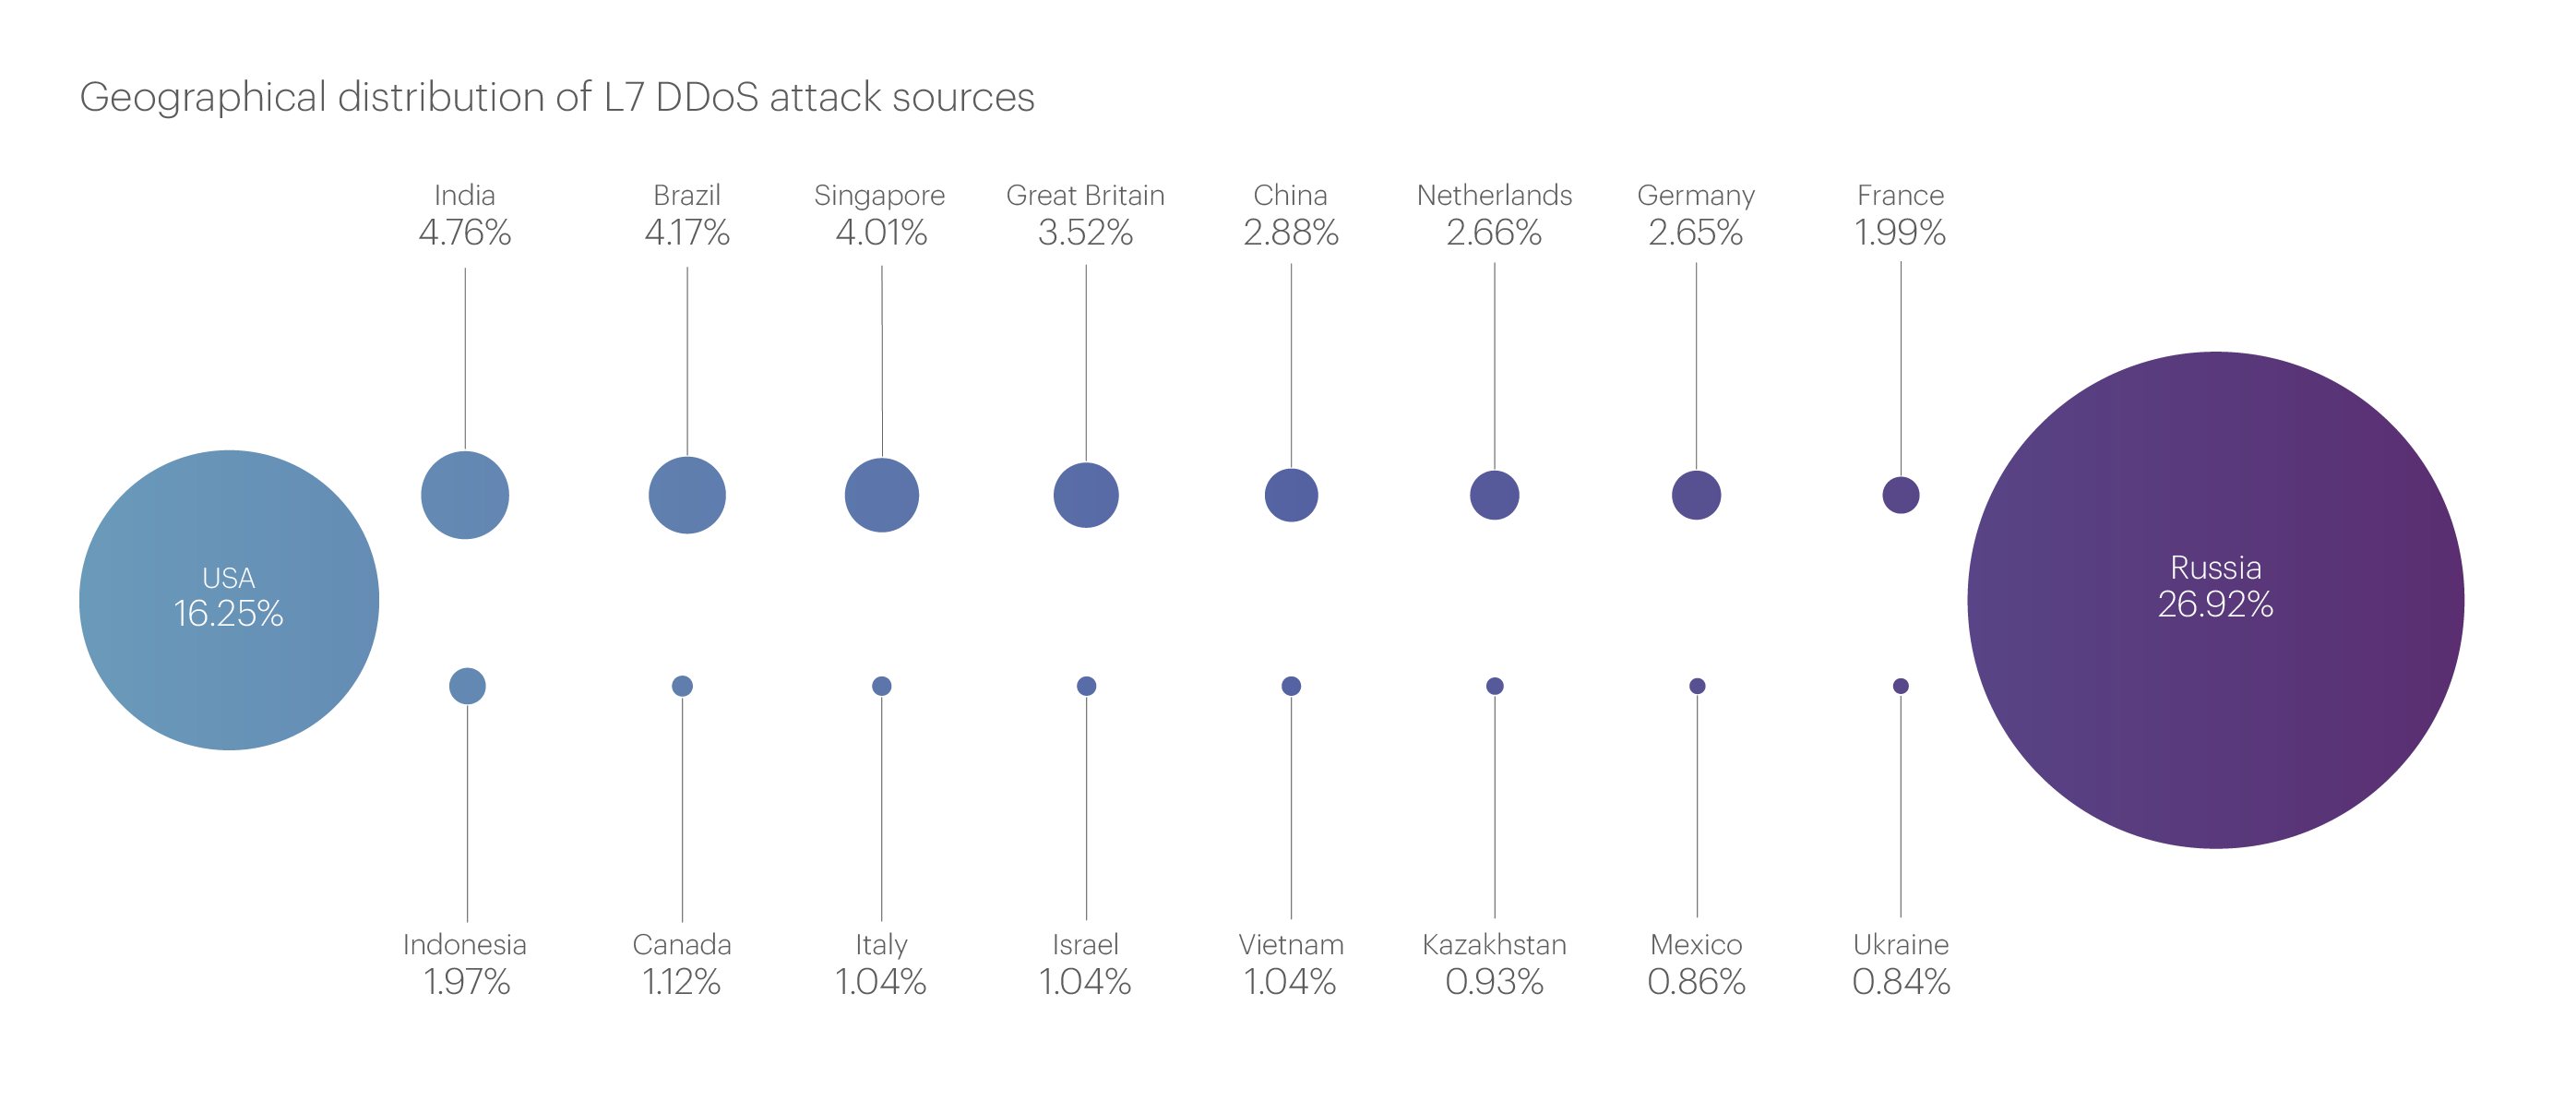
The rest of the top 10 sources of malicious traffic are as follows: Brazil (4.17%), Singapore (4.01%), the United Kingdom (3.52%), China (2.88%), the Netherlands (2.66%), Germany (2.65%) and France (1.99%). Together, these 10 countries account for more than two-thirds (69.81%) of all blocked IP addresses.
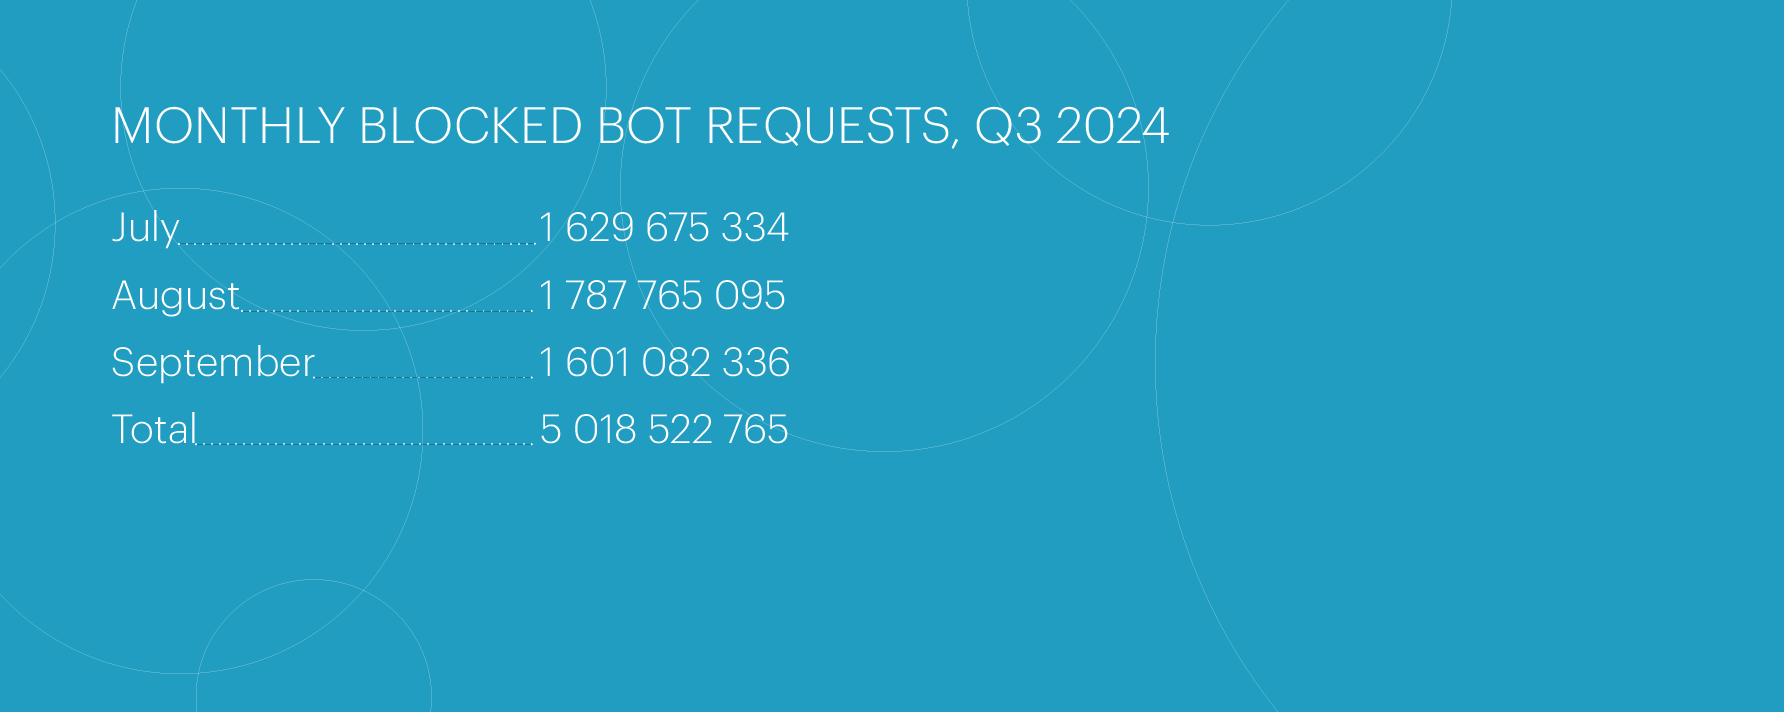
In the third quarter of 2024, the number of bot attacks remained roughly the same as in the previous two quarters. The total number of blocked bot requests reached 5,018,522,765 — about 5.5% lower than in Q2 and nearly the same as the number of requests blocked in Q1.
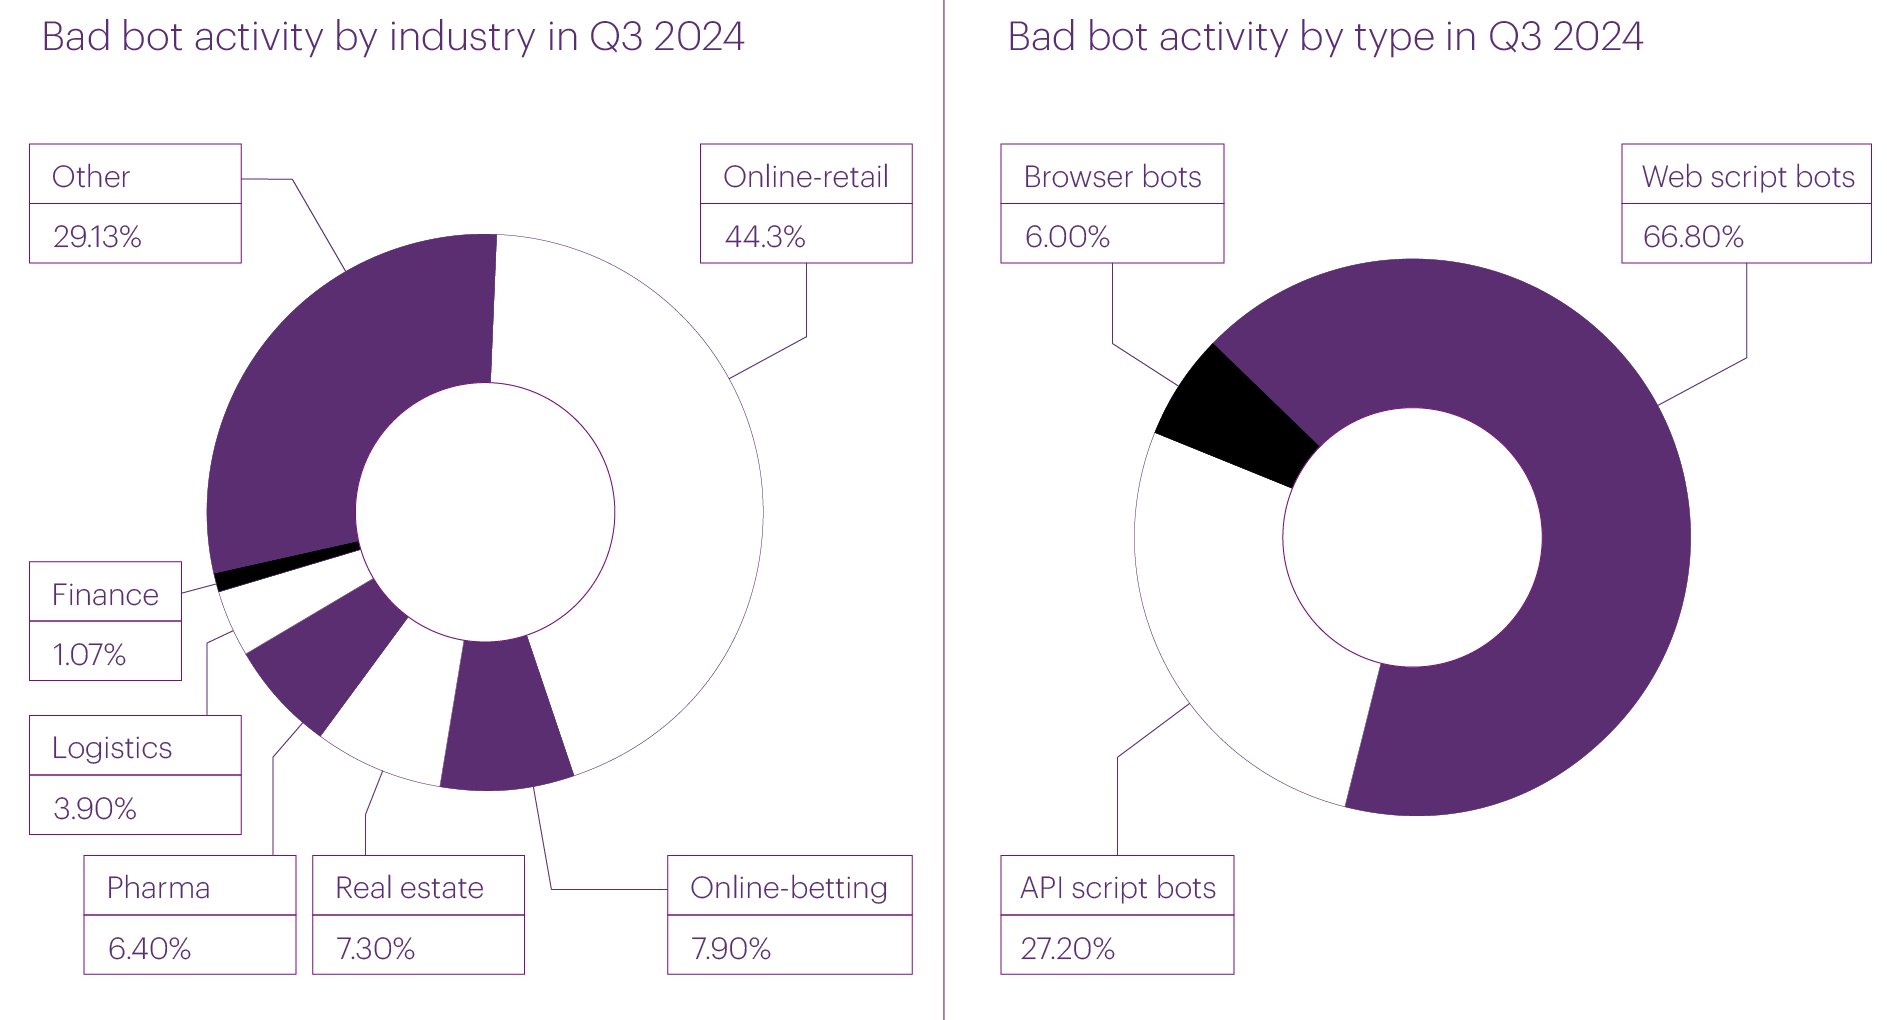
The largest number of bot attacks in the third quarter, as in the previous quarter, targeted the Online retail (44.3% of all bot activity), Betting shops (7.9%), Real estate (7.3%) and Pharma (6.4%) segments. This time, the Logistics (3.9%) and Banks (1.07%) also joined the list of “hot” industries. Together, these six categories account for approximately 70% of the bot attacks we recorded.
The largest bot attack in the third quarter was observed on August 8 and targeted the Online retail segment. During this attack, 22,165,509 bot requests were blocked, which is about 10% more than the highest number recorded in the previous quarter.
Just five days later, on August 13, the fastest bot attack of the third quarter took place. This attack, aimed at the Food retail segment, reached a speed of 77,000 requests per second — 400% higher than the maximum from the previous reporting period.
As for the distribution of bots by type, the situation remains roughly the same as in the second quarter. The majority are web script bots (66.8%), followed by API bots in second place (27.2%), and browser bots in third (4.4%).
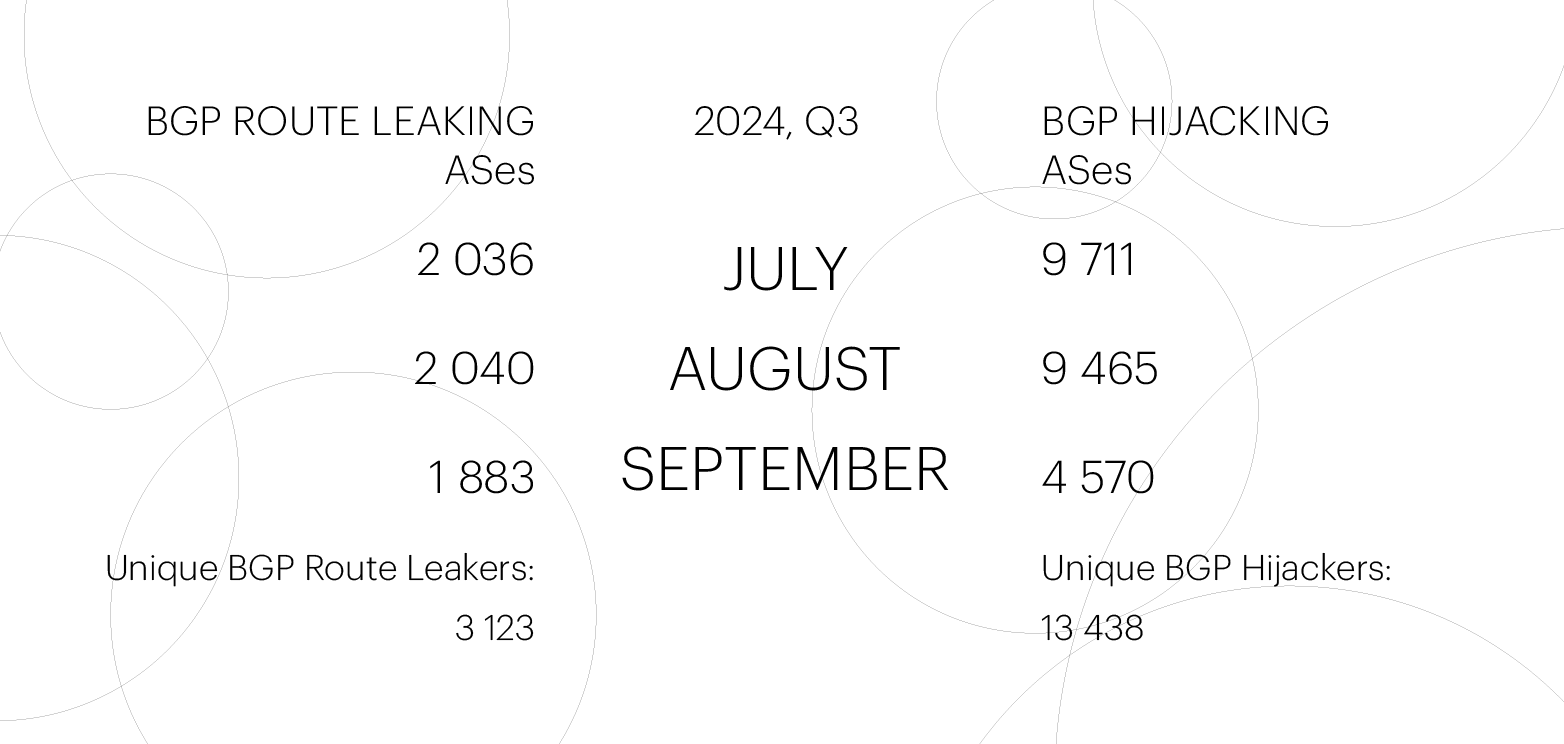
In the third quarter of 2024, the number of unique ASes involved in BGP Route Leaks remained almost unchanged relative to the second quarter: 3,123 (compared to 3,044 in the previous quarter). The number of ASes involved in BGP Hijacks also stayed roughly the same: there were 13,626 such incidents in Q2, and 13,438 in Q3.
As a reminder, to identify global BGP incidents, the Qrator.Radar team uses a set of threshold values. These criteria include the number of affected prefixes and autonomous systems, as well as the extent of the anomaly’s spread across routing tables.
The number of recorded global incidents nearly doubled in the third quarter. Specifically, the number of global BGP Leaks increased from 6 (Q2) to 11 (Q3).
We also observed two cases of global BGP Hijacks: the first occurred on July 9, and the second on August 22. In the previous quarter, only one such incident was recorded.
One noteworthy event was the successful prevention of a BGP route leak between Internet Exchanges. This was made possible by the use of the RFC 9234 standard, developed by Qrator Labs experts in collaboration with the Internet Engineering Task Force (IETF).
A particularly noteworthy incident of Q2 2024 was a major BGP route leak that took place on May 24, just a day before the mentioned BGP hijack. This leak was caused by the Brazilian provider Megatelecom and led to 5,333 conflicts involving 593 ASes from 68 countries.The leak resulted from the merging of network infrastructures during Megatelecom's acquisition of another Brazilian provider, InterNexa Brasil.


Share your experience and expectations regarding DDoS protection. Your answers will help us tailor solutions to meet your cybersecurity needs.
Tell us about your company’s infrastructure and critical systems. This will help us understand the scope of protection you require.
Help us learn about how decisions are made in your company. This information will guide us in offering the most relevant solutions.
Let us know what drives your choices when it comes to DDoS protection. Your input will help us focus on what matters most to you.