The number of L3-L4 DDoS attacks exceeding 1 Gbps in Q2 2025 increased significantly compared to the same period last year: we recorded 43% more such attacks than in Q2 2024. As a reminder, since the beginning of last year, we have excluded incidents with an intensity below 1 Gbps from our statistics.
The number of multivector attacks in Q2 2025 grew even slightly faster than the overall number of L3-L4 attacks, rising by 49% year over year. As a result, their share increased by nearly one percentage point — from 17.8% last year to 18.5%.
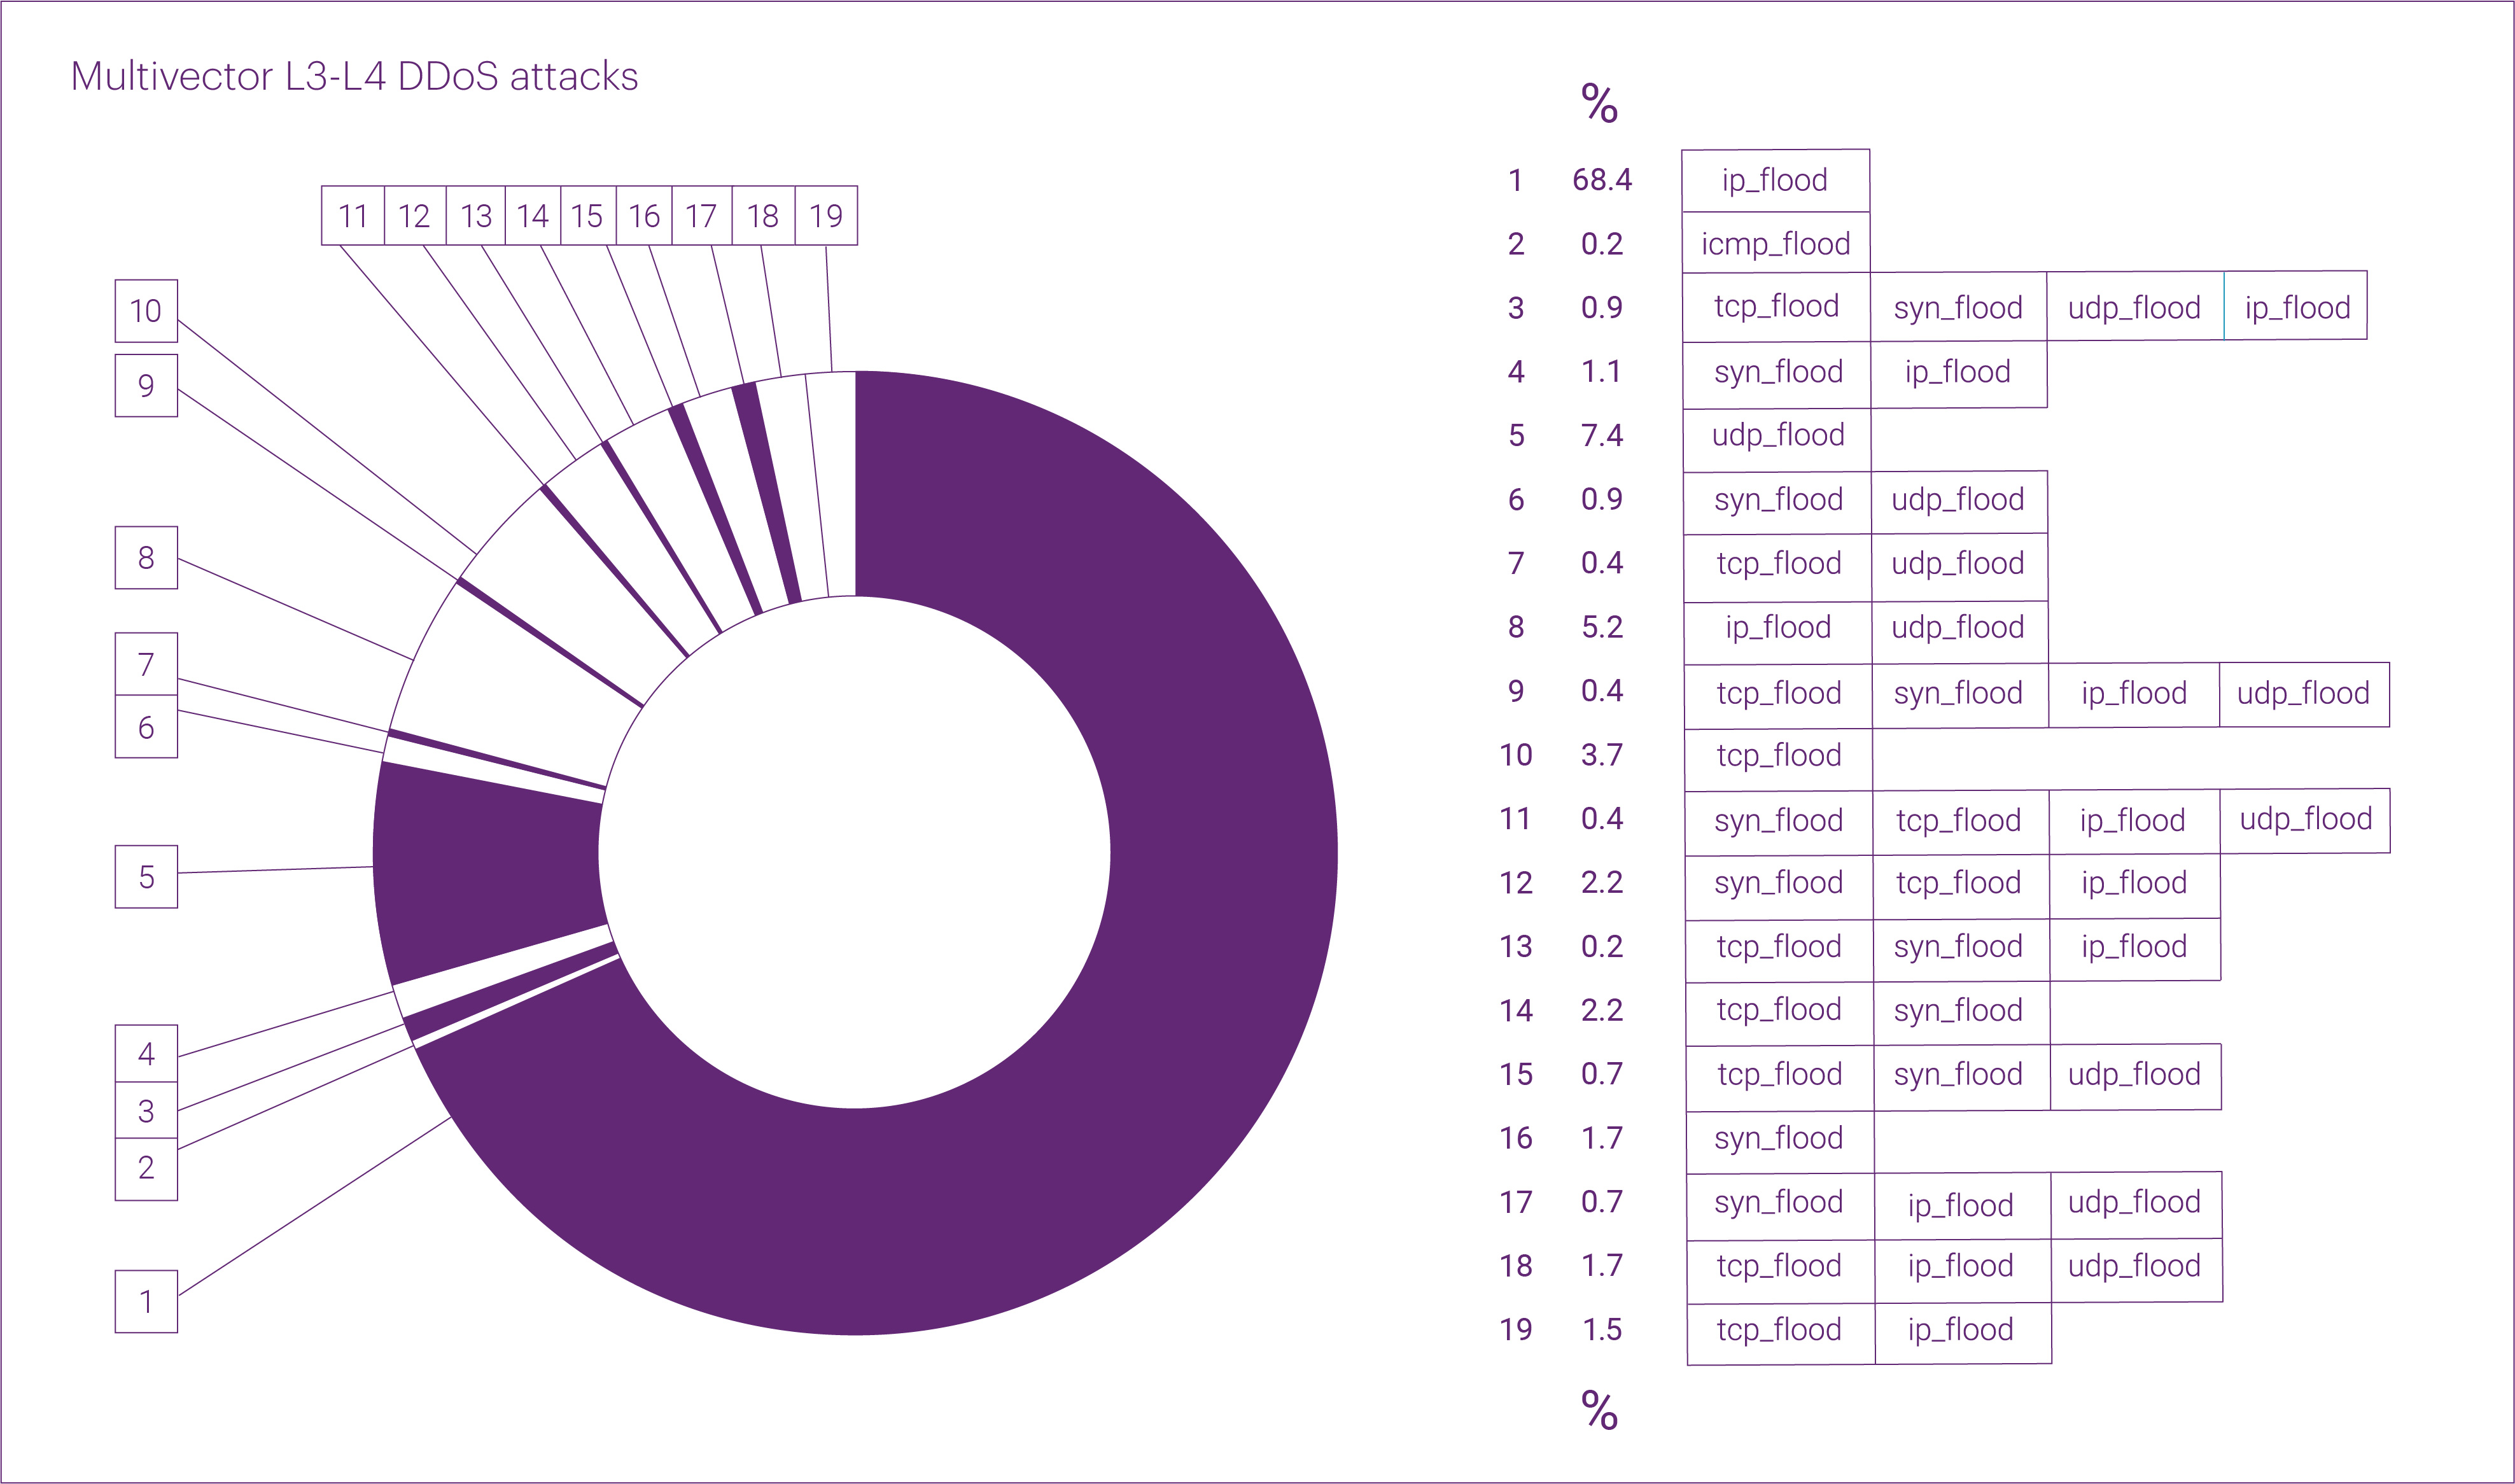
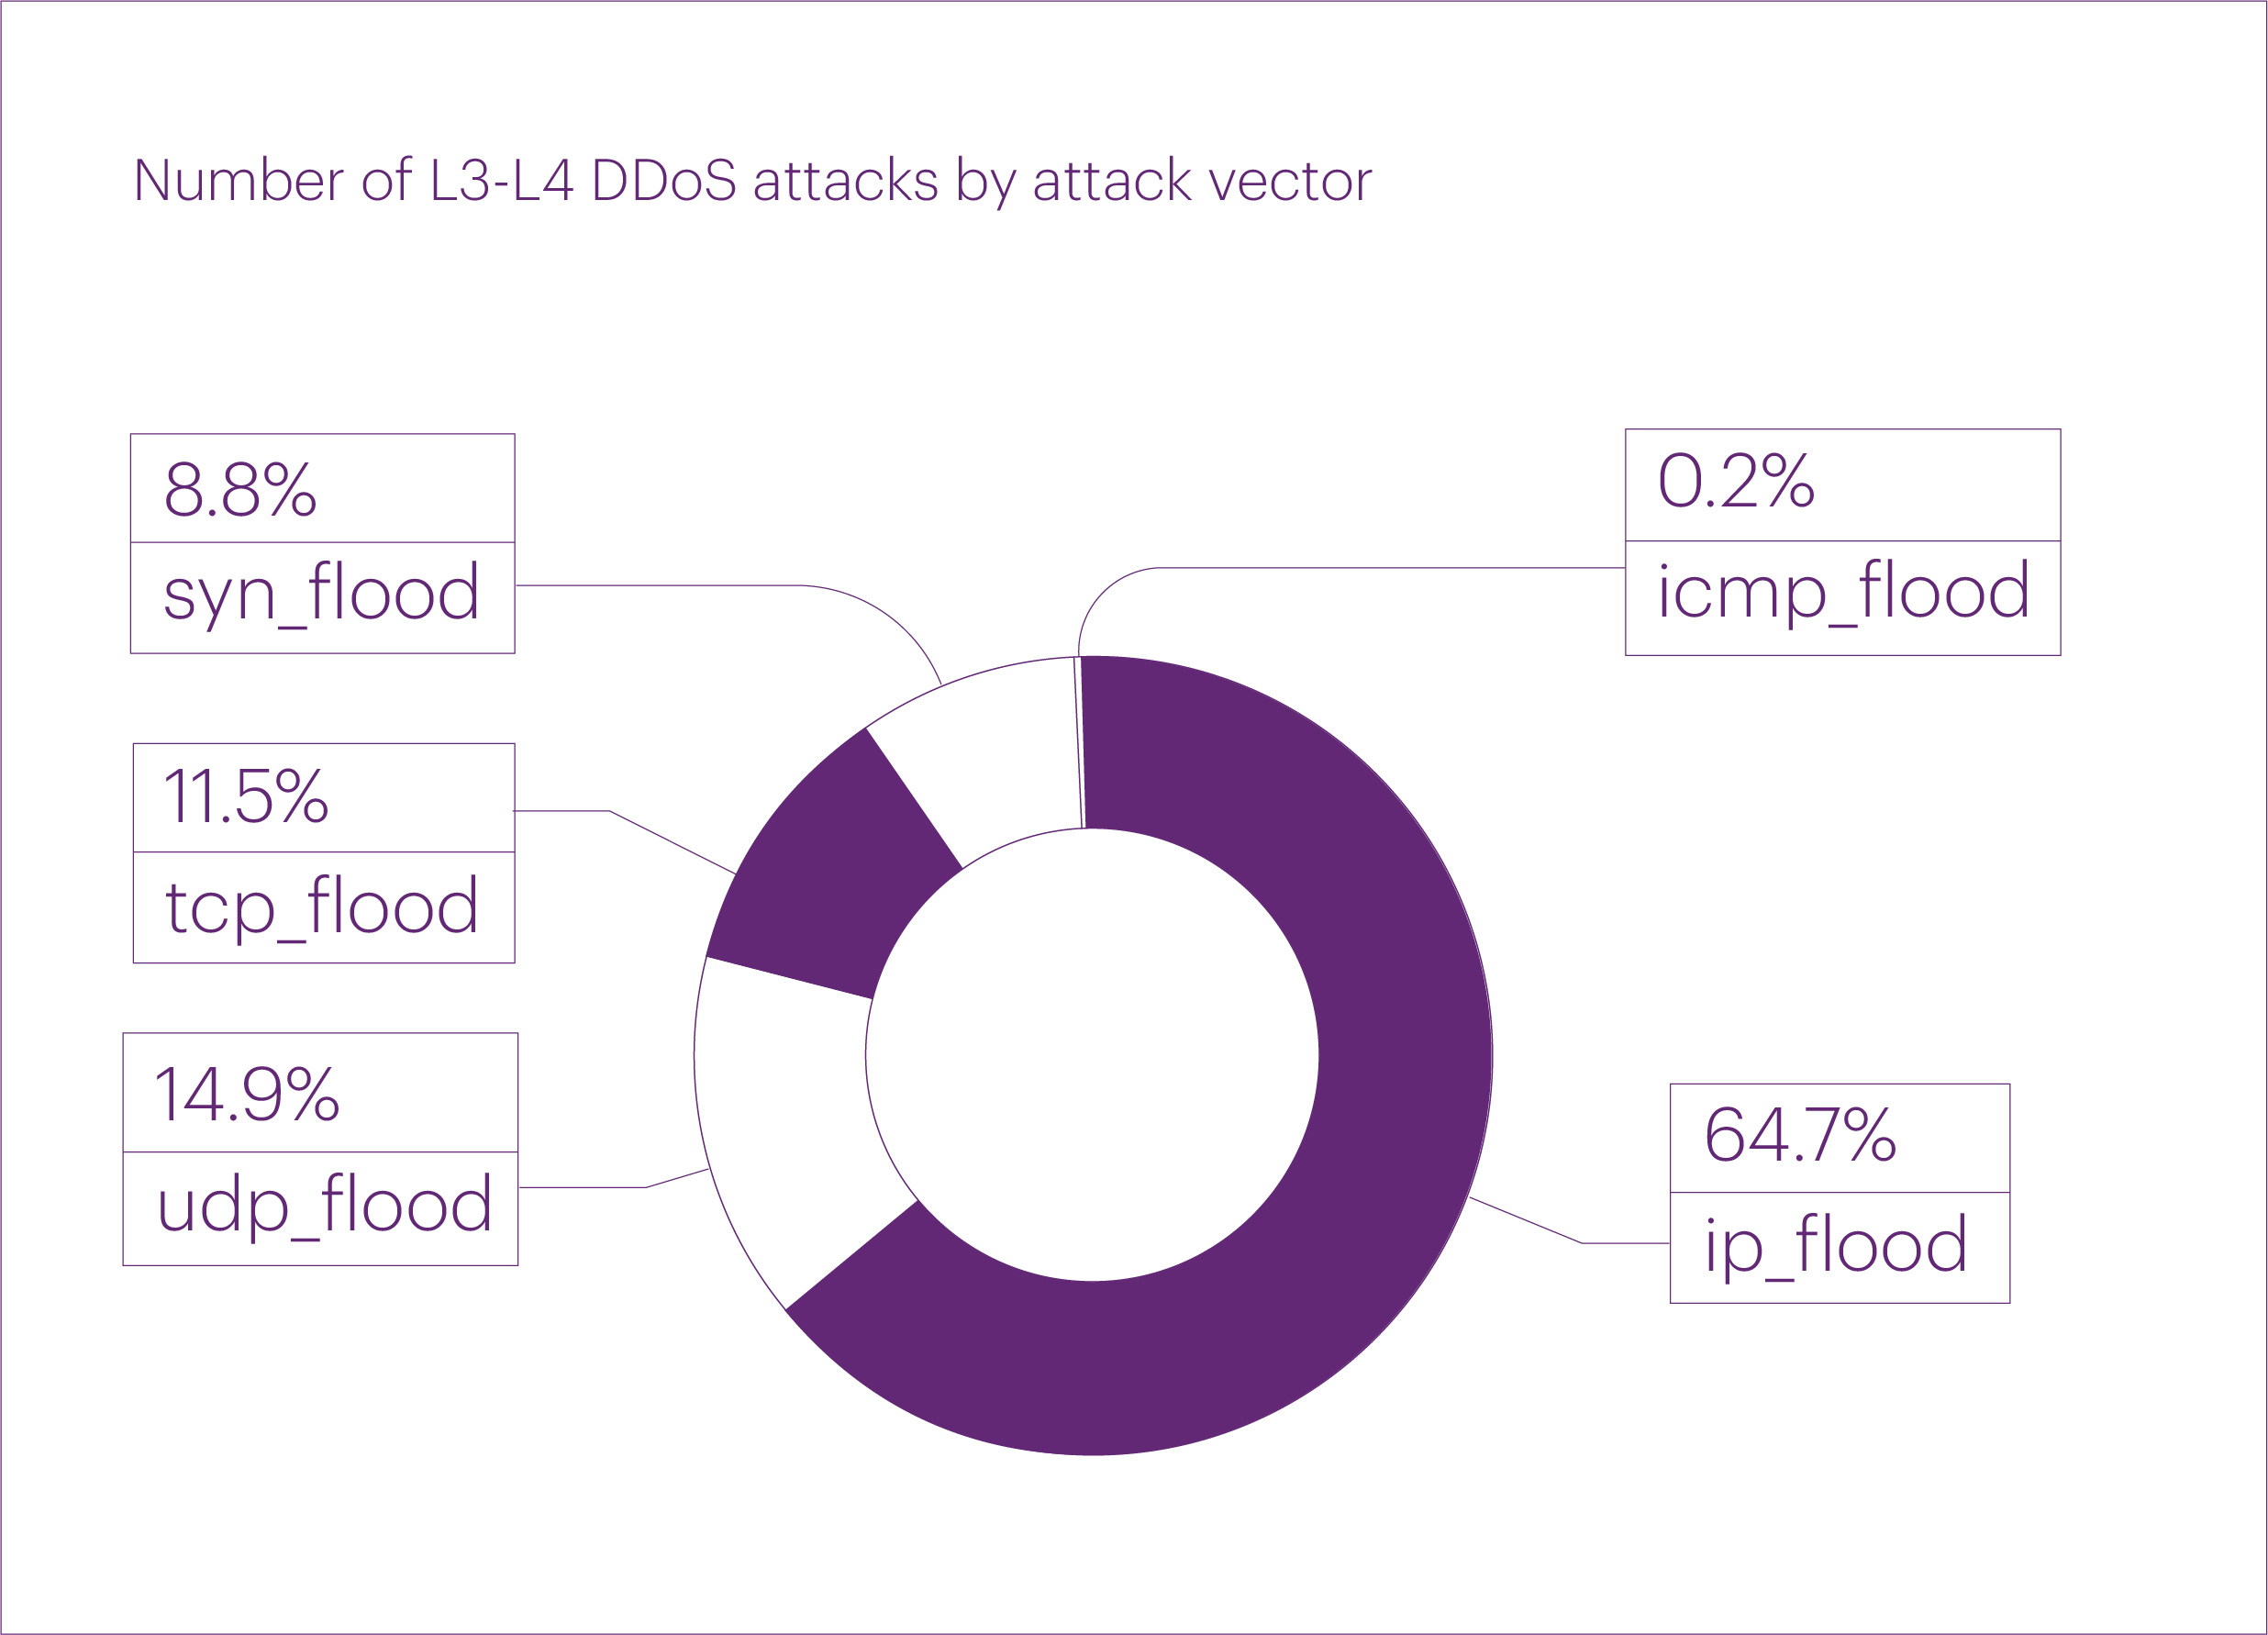
The distribution of “pure” attack vectors in Q2 2025 was as follows: IP flood took the lead, accounting for almost two-thirds of all L3-L4 DDoS attacks (64.7%) during the quarter. Far behind were UDP flood (14.9%), TCP flood (11.5%), and SYN flood (8.8%).
ICMP flood attacks appear to have completely fallen out of favor with attackers — in Q2, their share was negligible (0.2%), while in Q1 2025, we did not record any such attacks at all.
The top three longest L3-L4 DDoS attacks in Q2 2025 were as follows: the longest targeted the “Betting shops” microsegment and lasted just over four days — 96.5 hours. It was followed by attacks targeting the “Telecom operators” microsegment (42.8 hours) and the “Hosting platforms” microsegment (20.7 hours). For comparison, the 2024 record was 19 days (463.9 hours).
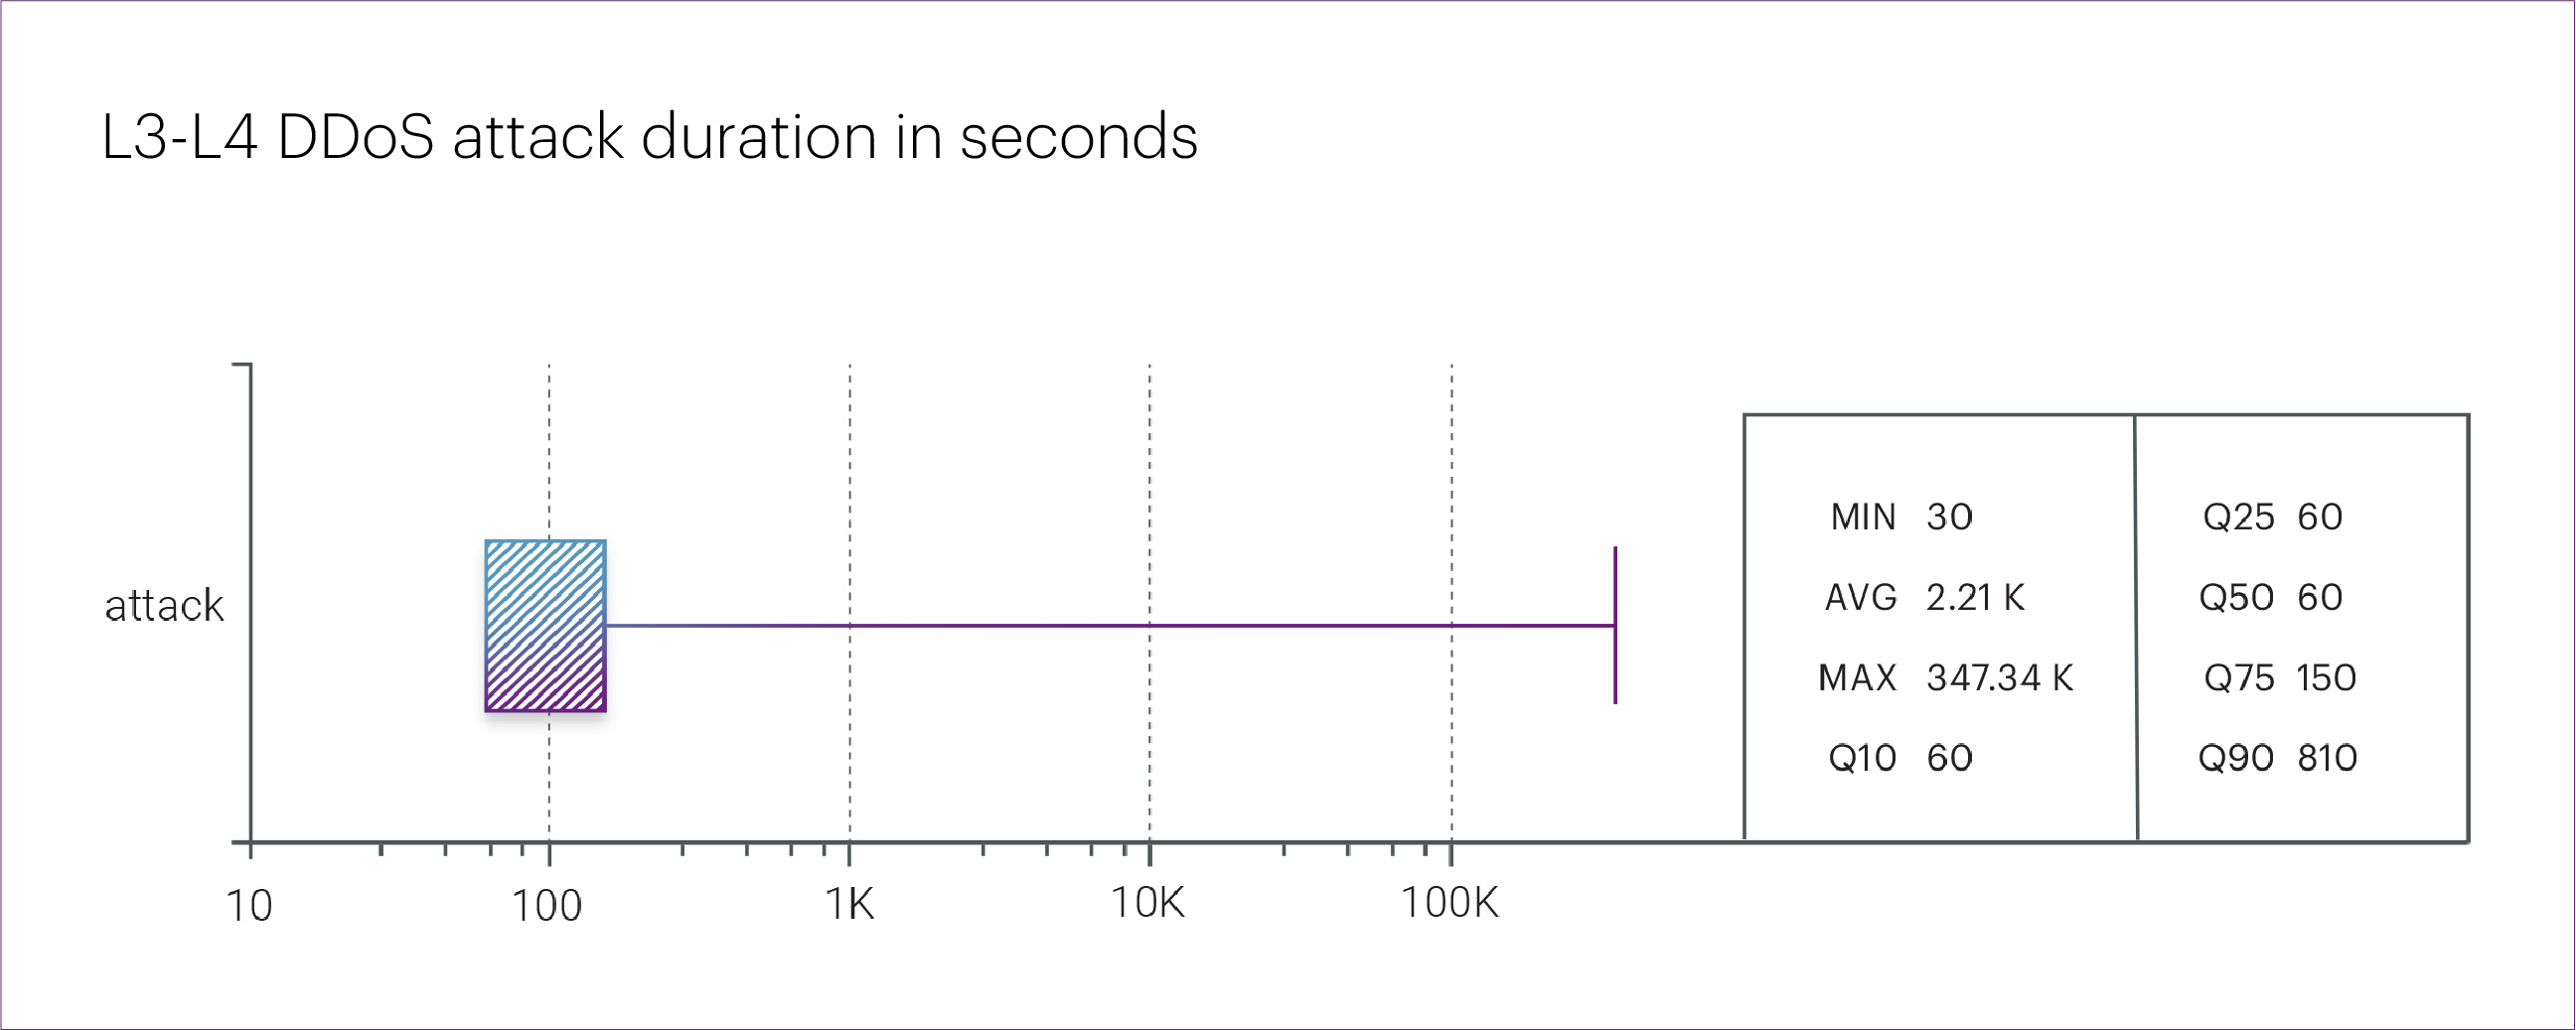
Overall, most attacks in Q2 2025 were slightly shorter than in the same quarter of the previous year. For example, the average attack duration decreased from 40 minutes last year to 36.8 minutes in Q2 this year. The median duration dropped even more significantly: from 150 seconds to just 60 seconds.
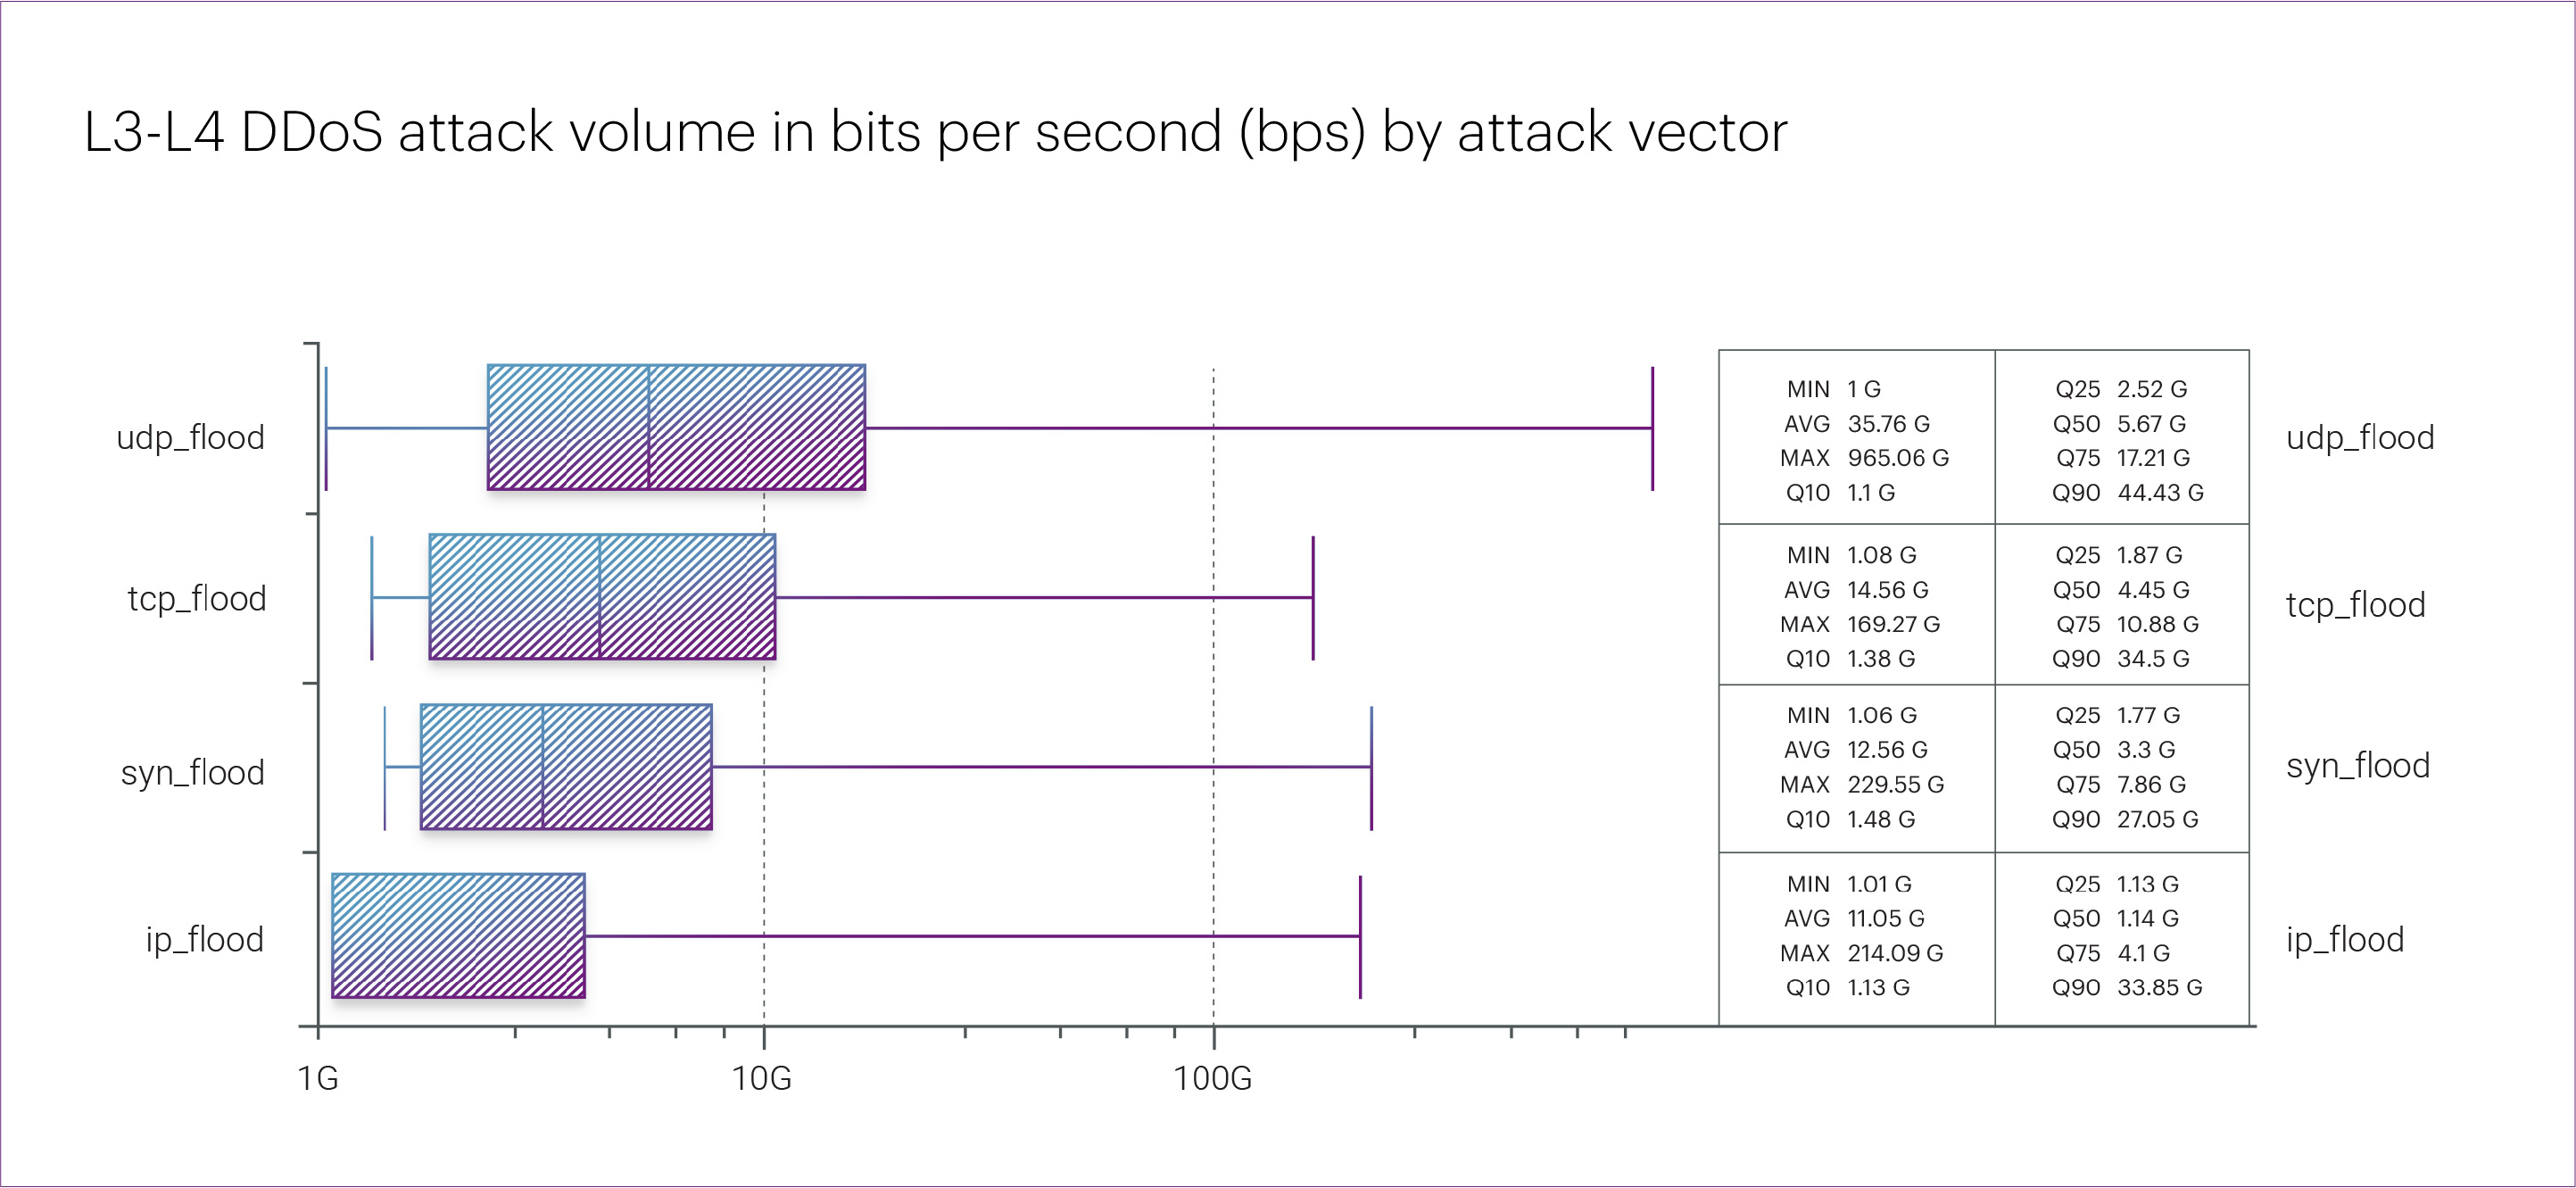
The most intense DDoS incident of Q2 and the entire first half of 2025 was recorded on April 3. The attack targeted an organization in the “Betting shops” microsegment and peaked at 965 Gbps — just slightly below last year’s record of 1,140 Gbps.
The attack lasted about an hour and a half and unfolded in several waves, with the peak occurring around the 20-minute mark. It was a multivector attack, with the following peak intensities across different vectors: UDP flood — 965 Gbps, SYN flood — 229 Gbps, IP flood — 214 Gbps, and TCP flood — 169 Gbps.
The timing of the attack suggests a likely connection to a historic moment in NHL history — Alexander Ovechkin’s record-breaking achievement. On April 3, Ovechkin scored his 892nd goal, followed by his 894th on April 5 (tying Wayne Gretzky’s all-time record) and his 895th on April 6 (breaking the record). We believe that the surge in betting activity linked to this event likely triggered the attack.
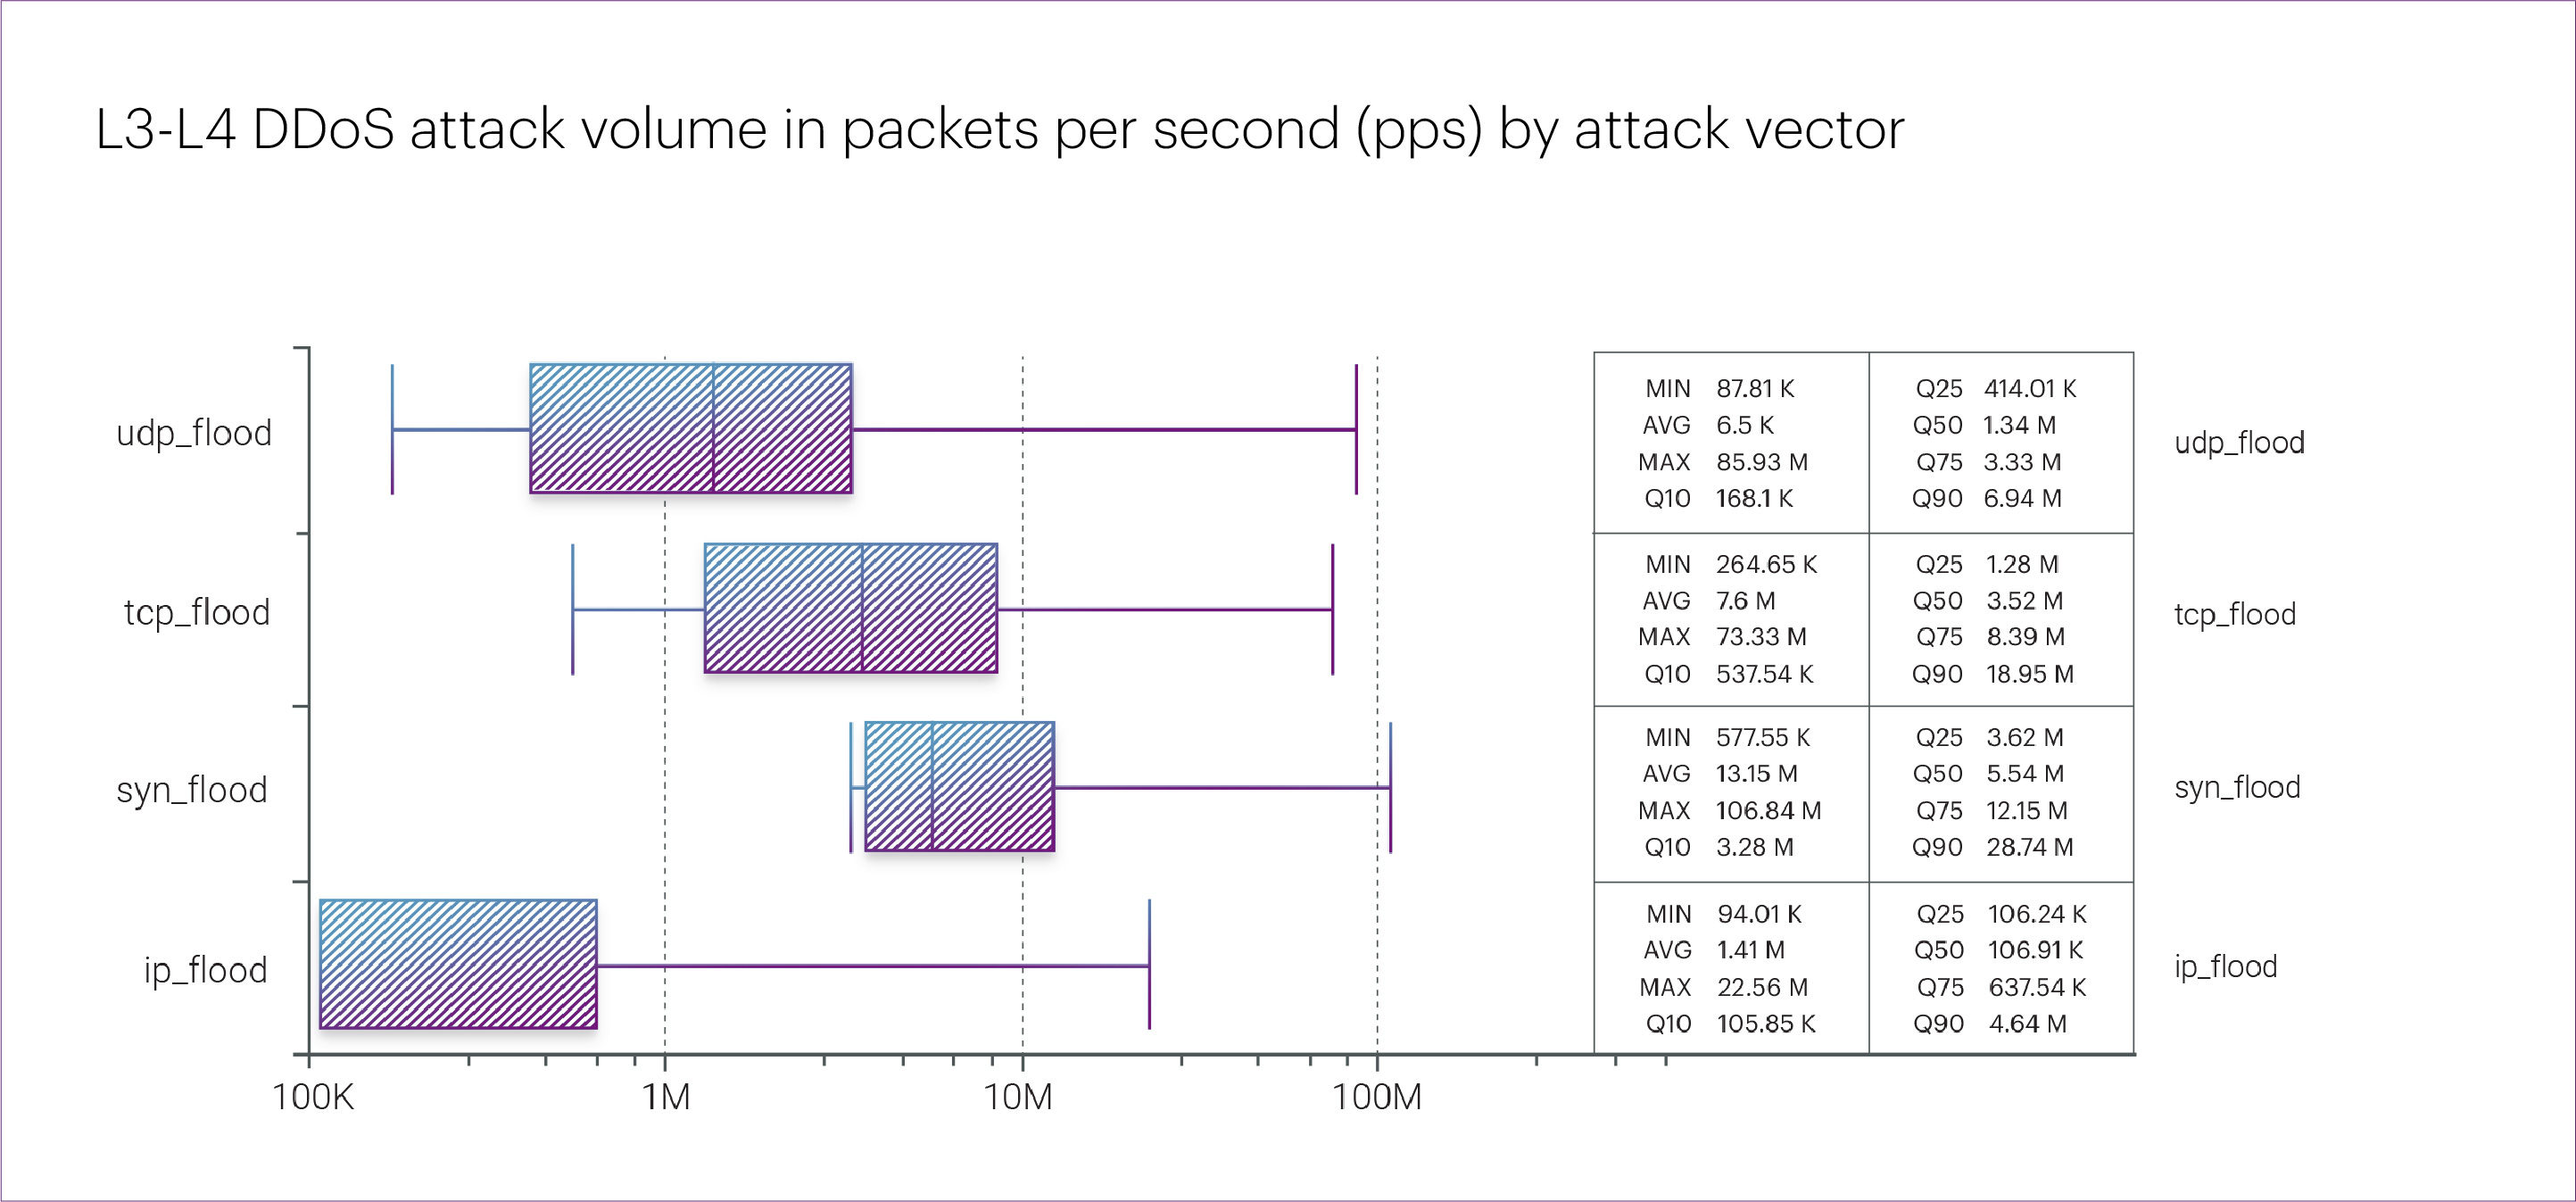
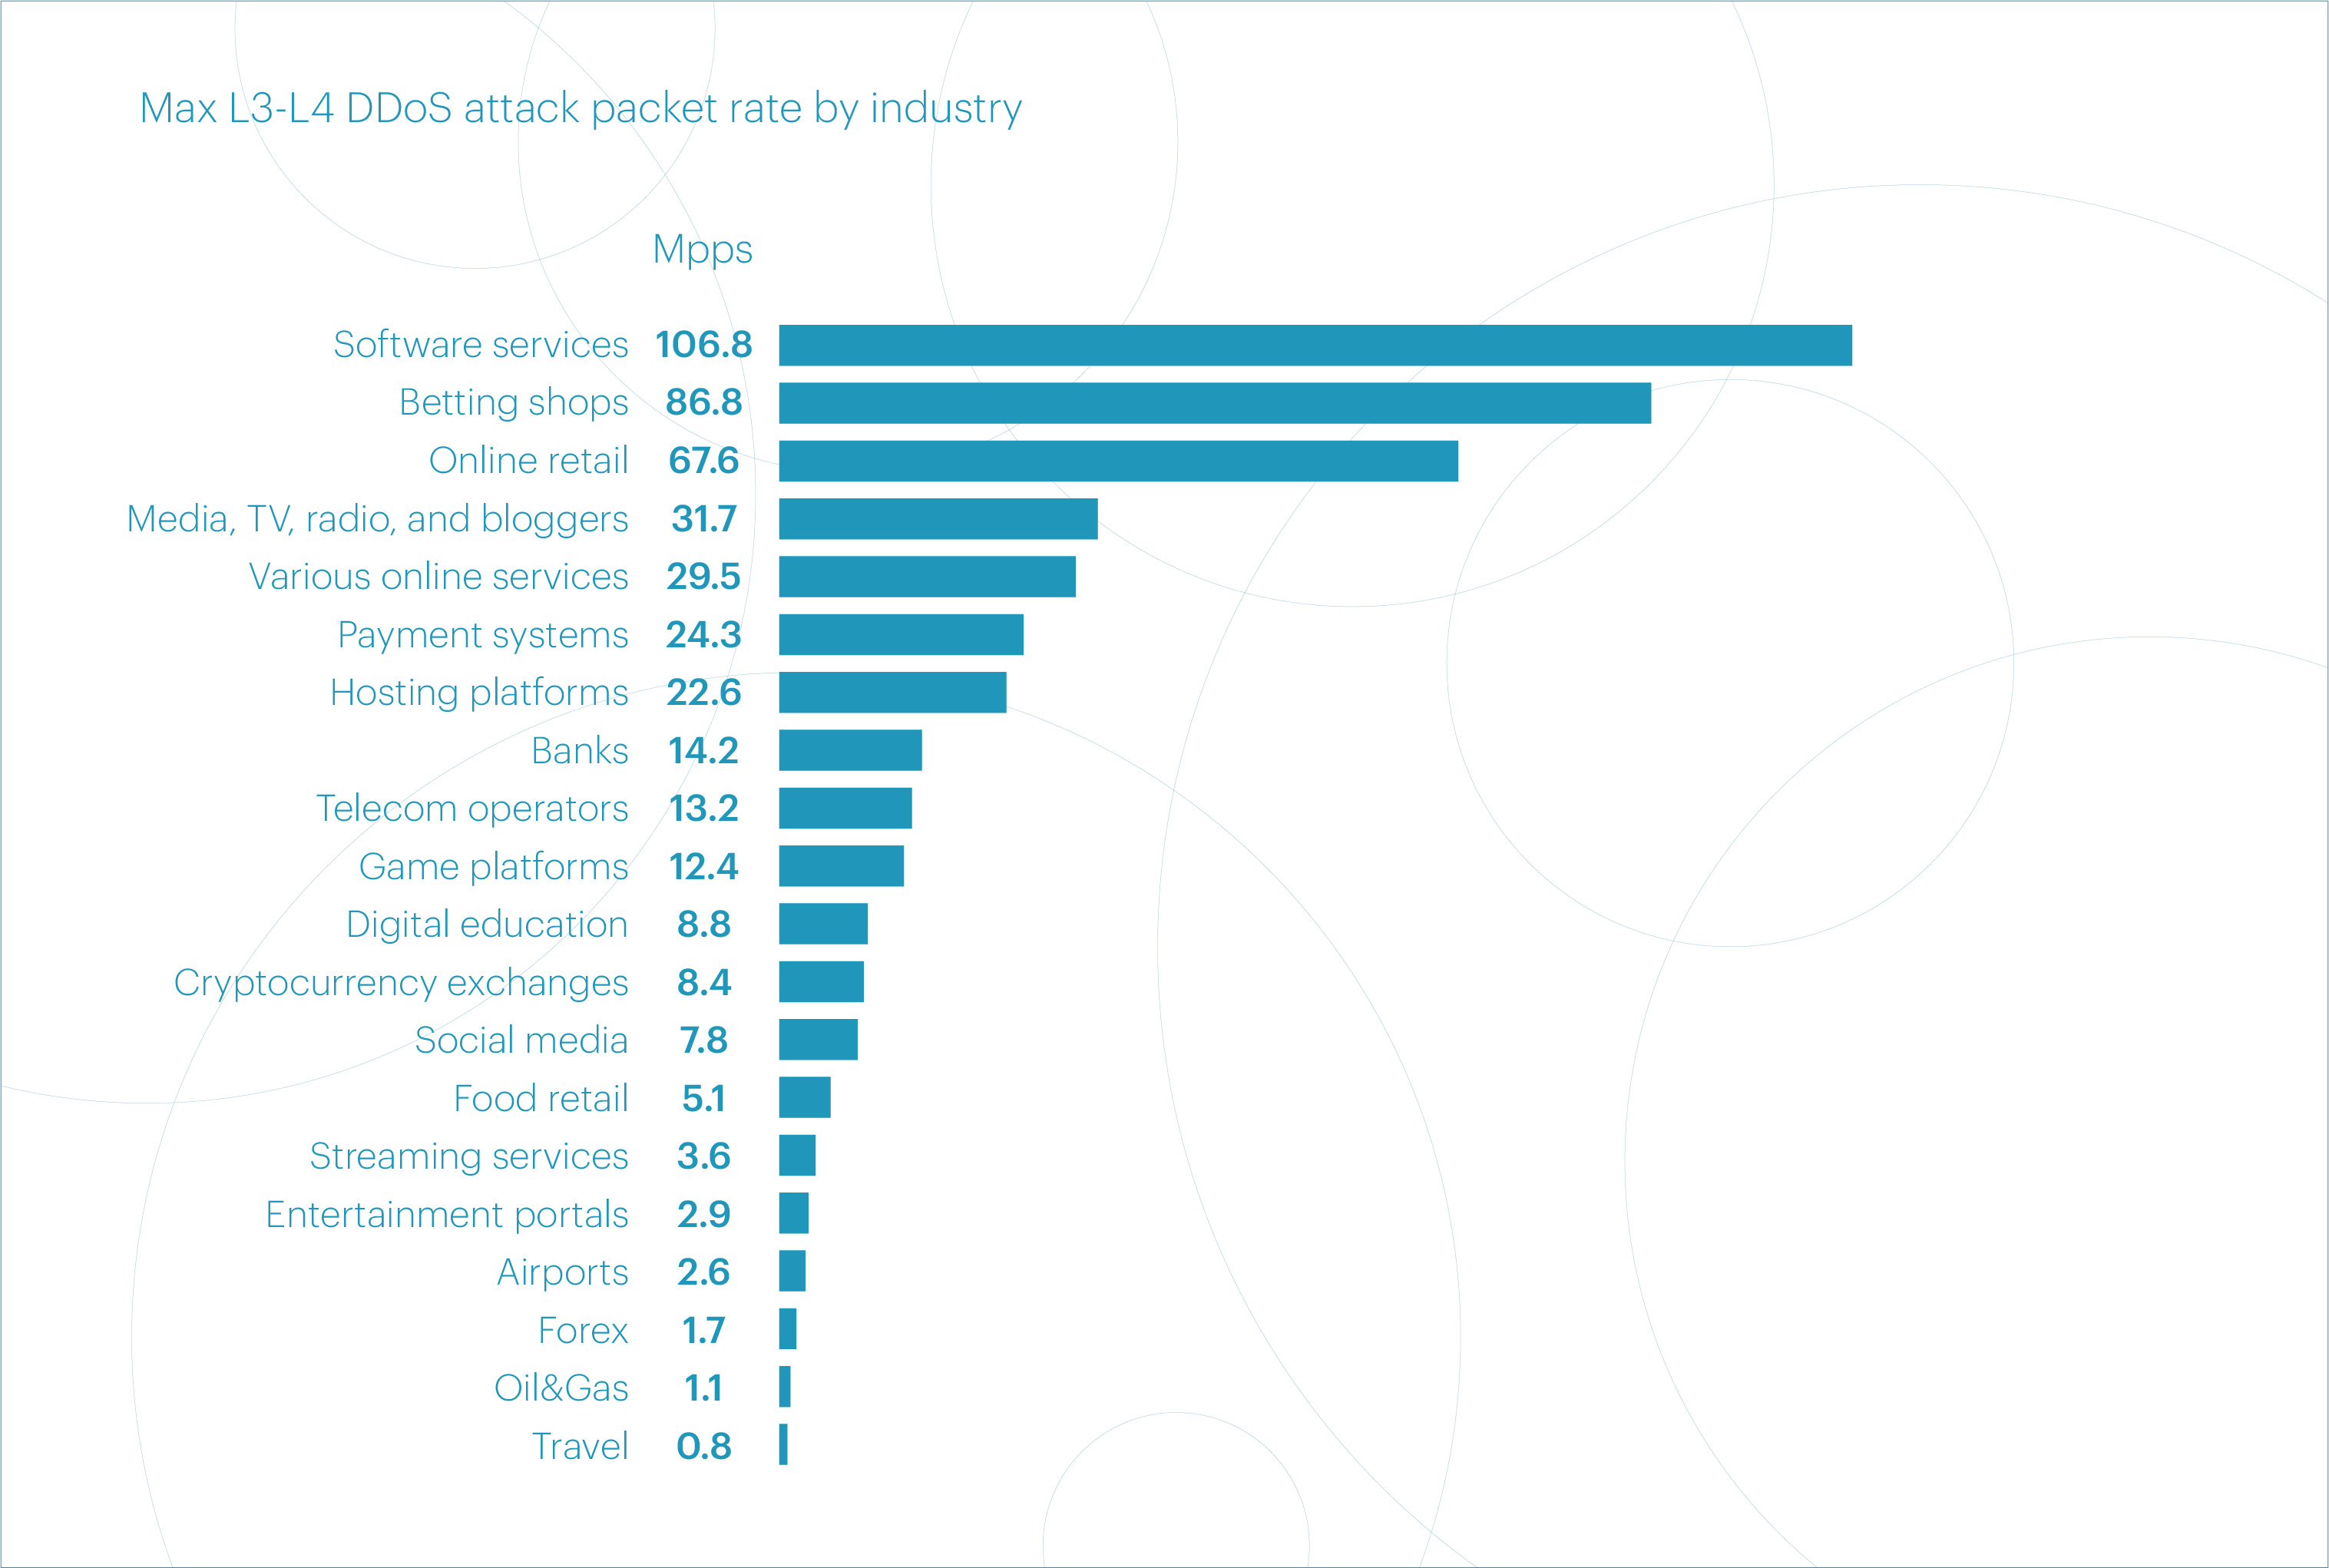
The largest attack of the quarter in terms of maximum packet rate was significantly higher than the previous year: 106.8 Mpps in Q2 2025 versus 63.6 Mpps in Q2 2024.
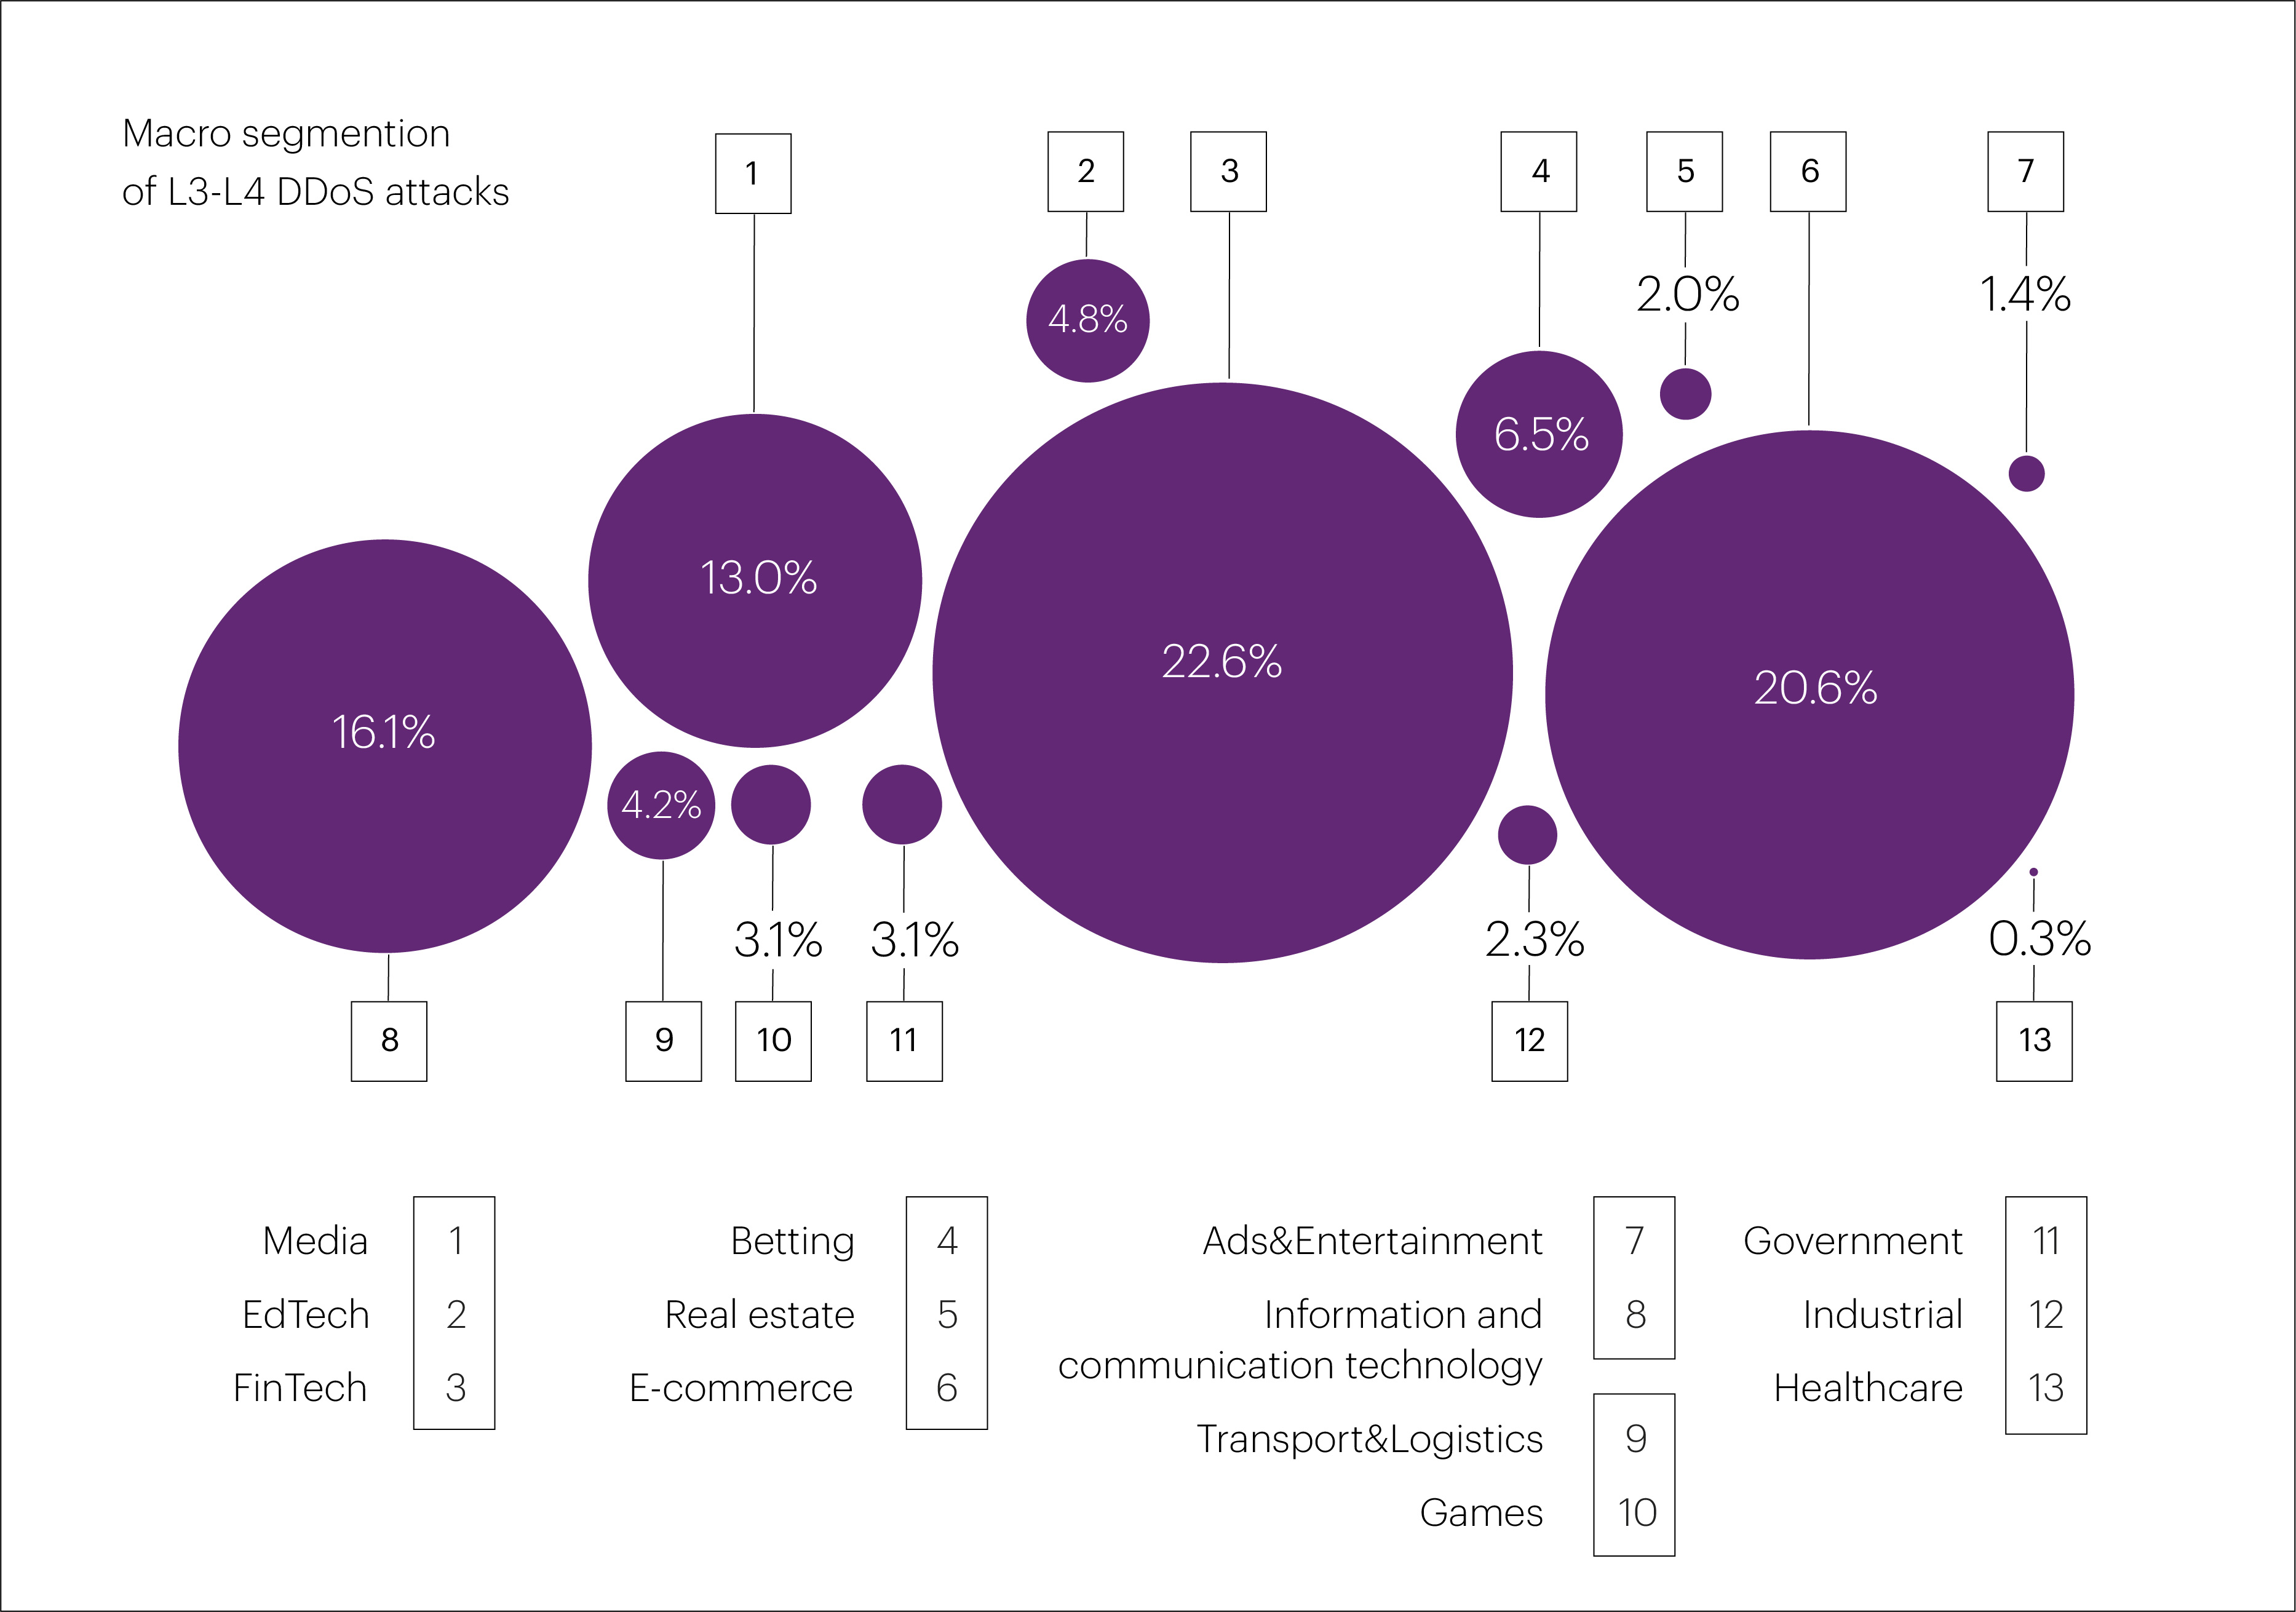
In Q2 2025, most L3-L4 DDoS attacks targeted the “FinTech” (22.6%), “E-commerce” (20.6%), and “Information and communication technology” (16.1%) segments. Combined, these three industries accounted for 59.3% of all L3-L4 attacks recorded during the quarter.
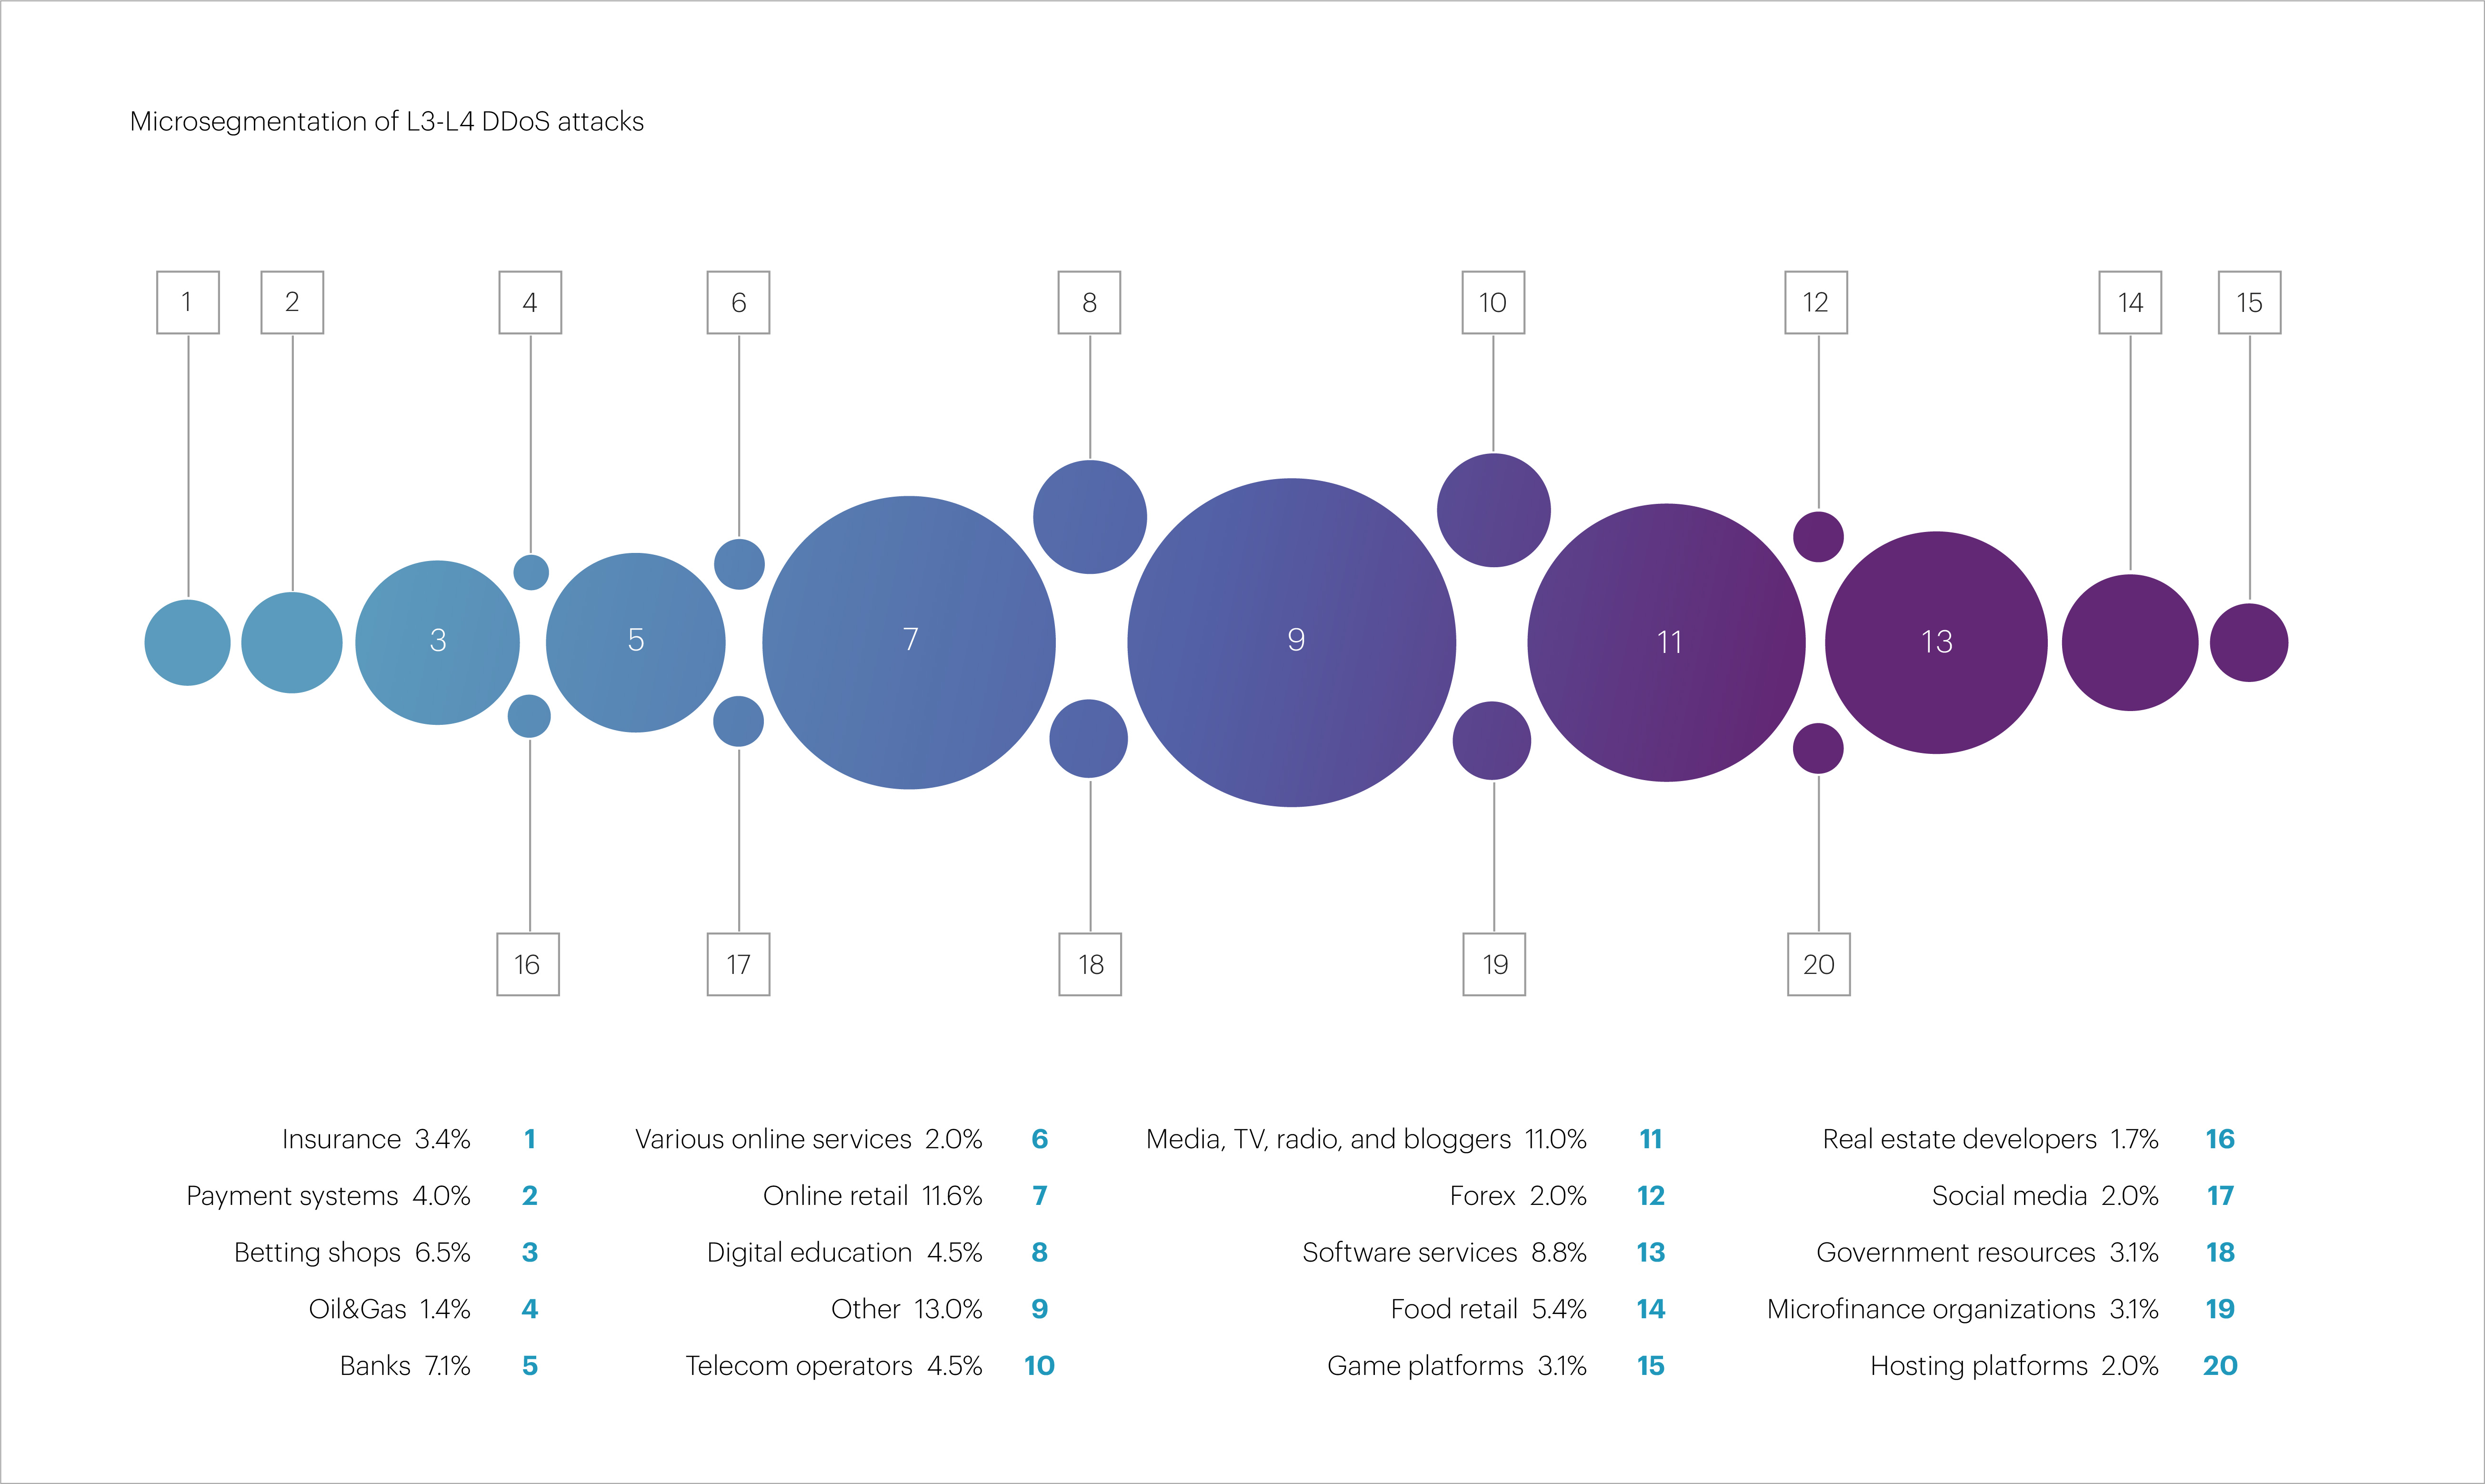
Looking at a more detailed breakdown, the most targeted microsegments in Q2 2025 were “Online retail” (11.6%), “Media, TV, radio, and bloggers” (11%), “Software services” (8.8%), “Banks” (7.1%), and “Betting shops” (6.5%). Together, these five microsegments accounted for nearly half (44.9%) of all attacks observed during the reporting period.
After a dip in Q1 2025, the duration of L3-L4 DDoS attacks returned to more typical levels. The longest attack targeted the “Betting shops” microsegment and lasted over four days — 96.5 hours.
The second-longest attack hit the “Telecom operators” microsegment, lasting about one and a half days (42.8 hours). In third place was an attack targeting the “Hosting platforms” microsegment, which continued for 20.7 hours.
For comparison, the record for the longest L3-L4 DDoS attack in 2024 was nearly 19 days (463.9 hours). In the previous quarter, the longest attack lasted 9.6 hours, while the longest L3-L4 incident in Q2 2024 lasted exactly three days — 72 hours.
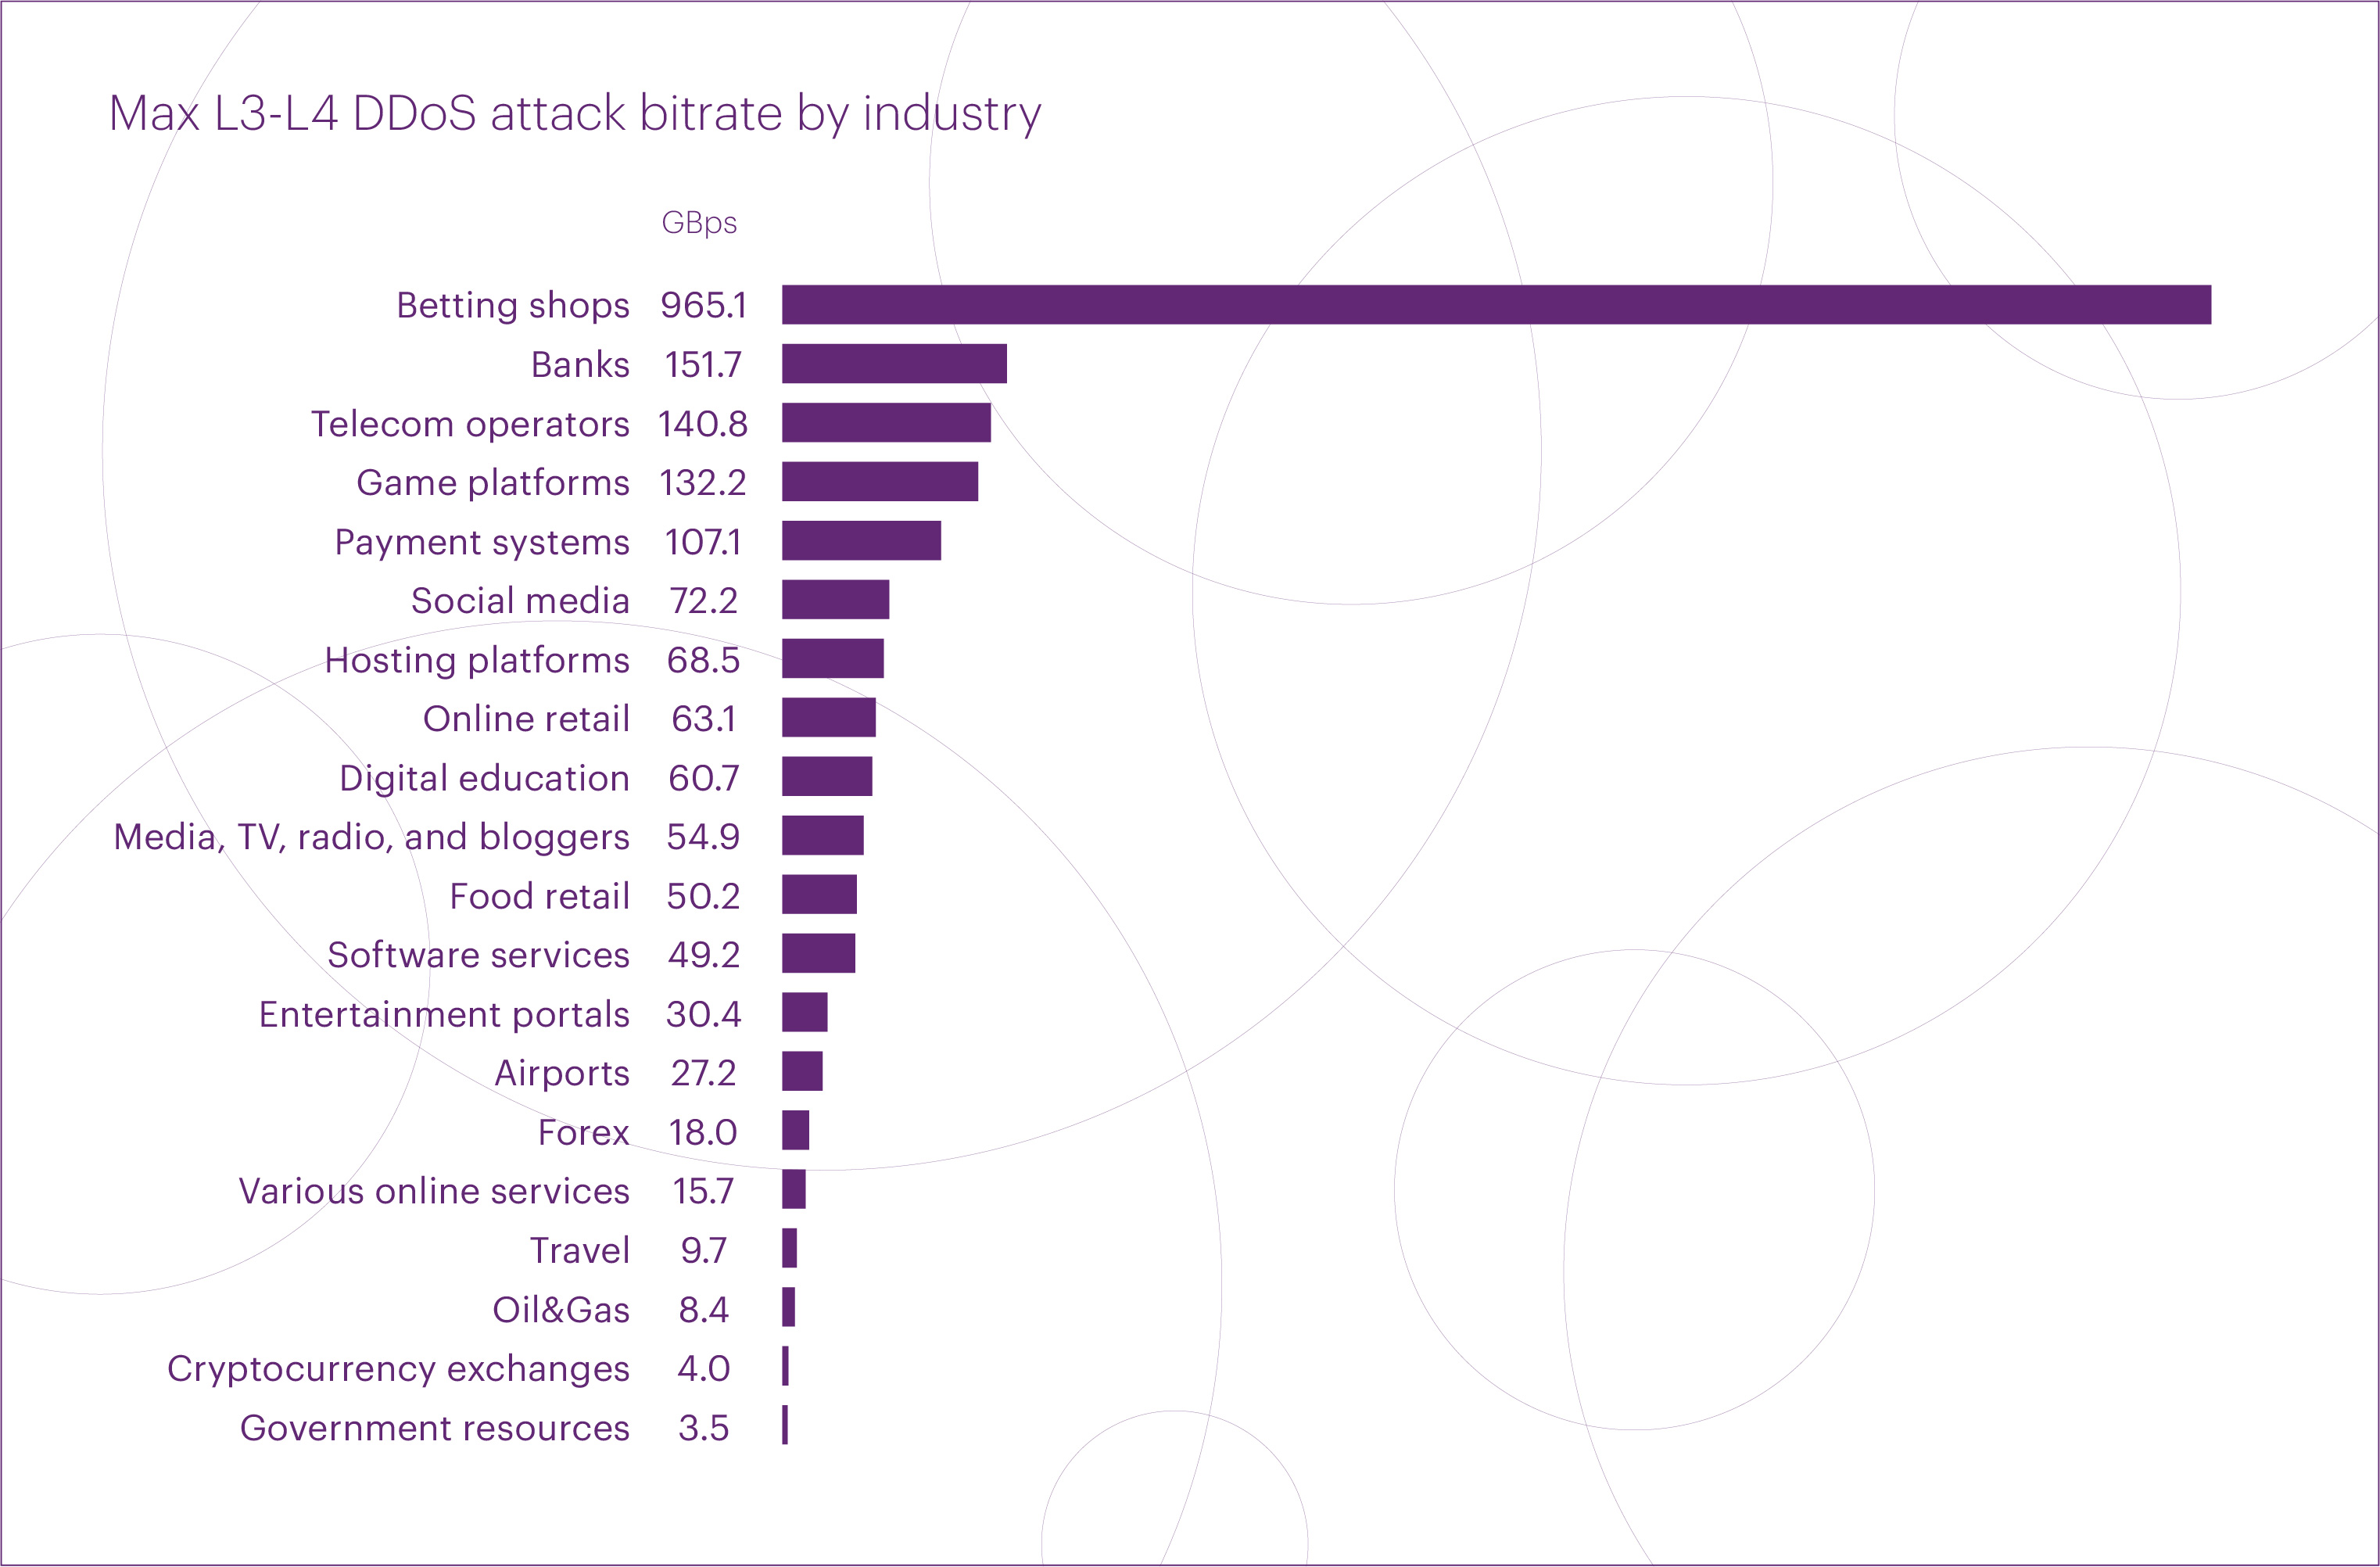
The top five microsegments that experienced the most intense L3-L4 DDoS attacks in Q2 2025 were: “Betting shops” (965 Gbps), “Banks” (152 Gbps), “Telecom operators” (141 Gbps), “Game platforms” (132 Gbps), and “Payment systems” (107 Gbps).
The top five microsegments by maximum packet rate in Q2 included: “Software services” (107 Mpps), “Betting shops” (87 Mpps), “Online retail” (68 Mpps), “Media, TV, radio, and bloggers” (32 Mpps), and “Various online services” (30 Mpps).
As with attack duration, following a noticeable dip in Q1, the intensity of L3-L4 attacks returned to levels comparable to last year.
Q2 2025 saw a surge in the number of L7 DDoS attacks, with a 74% increase compared to the same quarter last year.
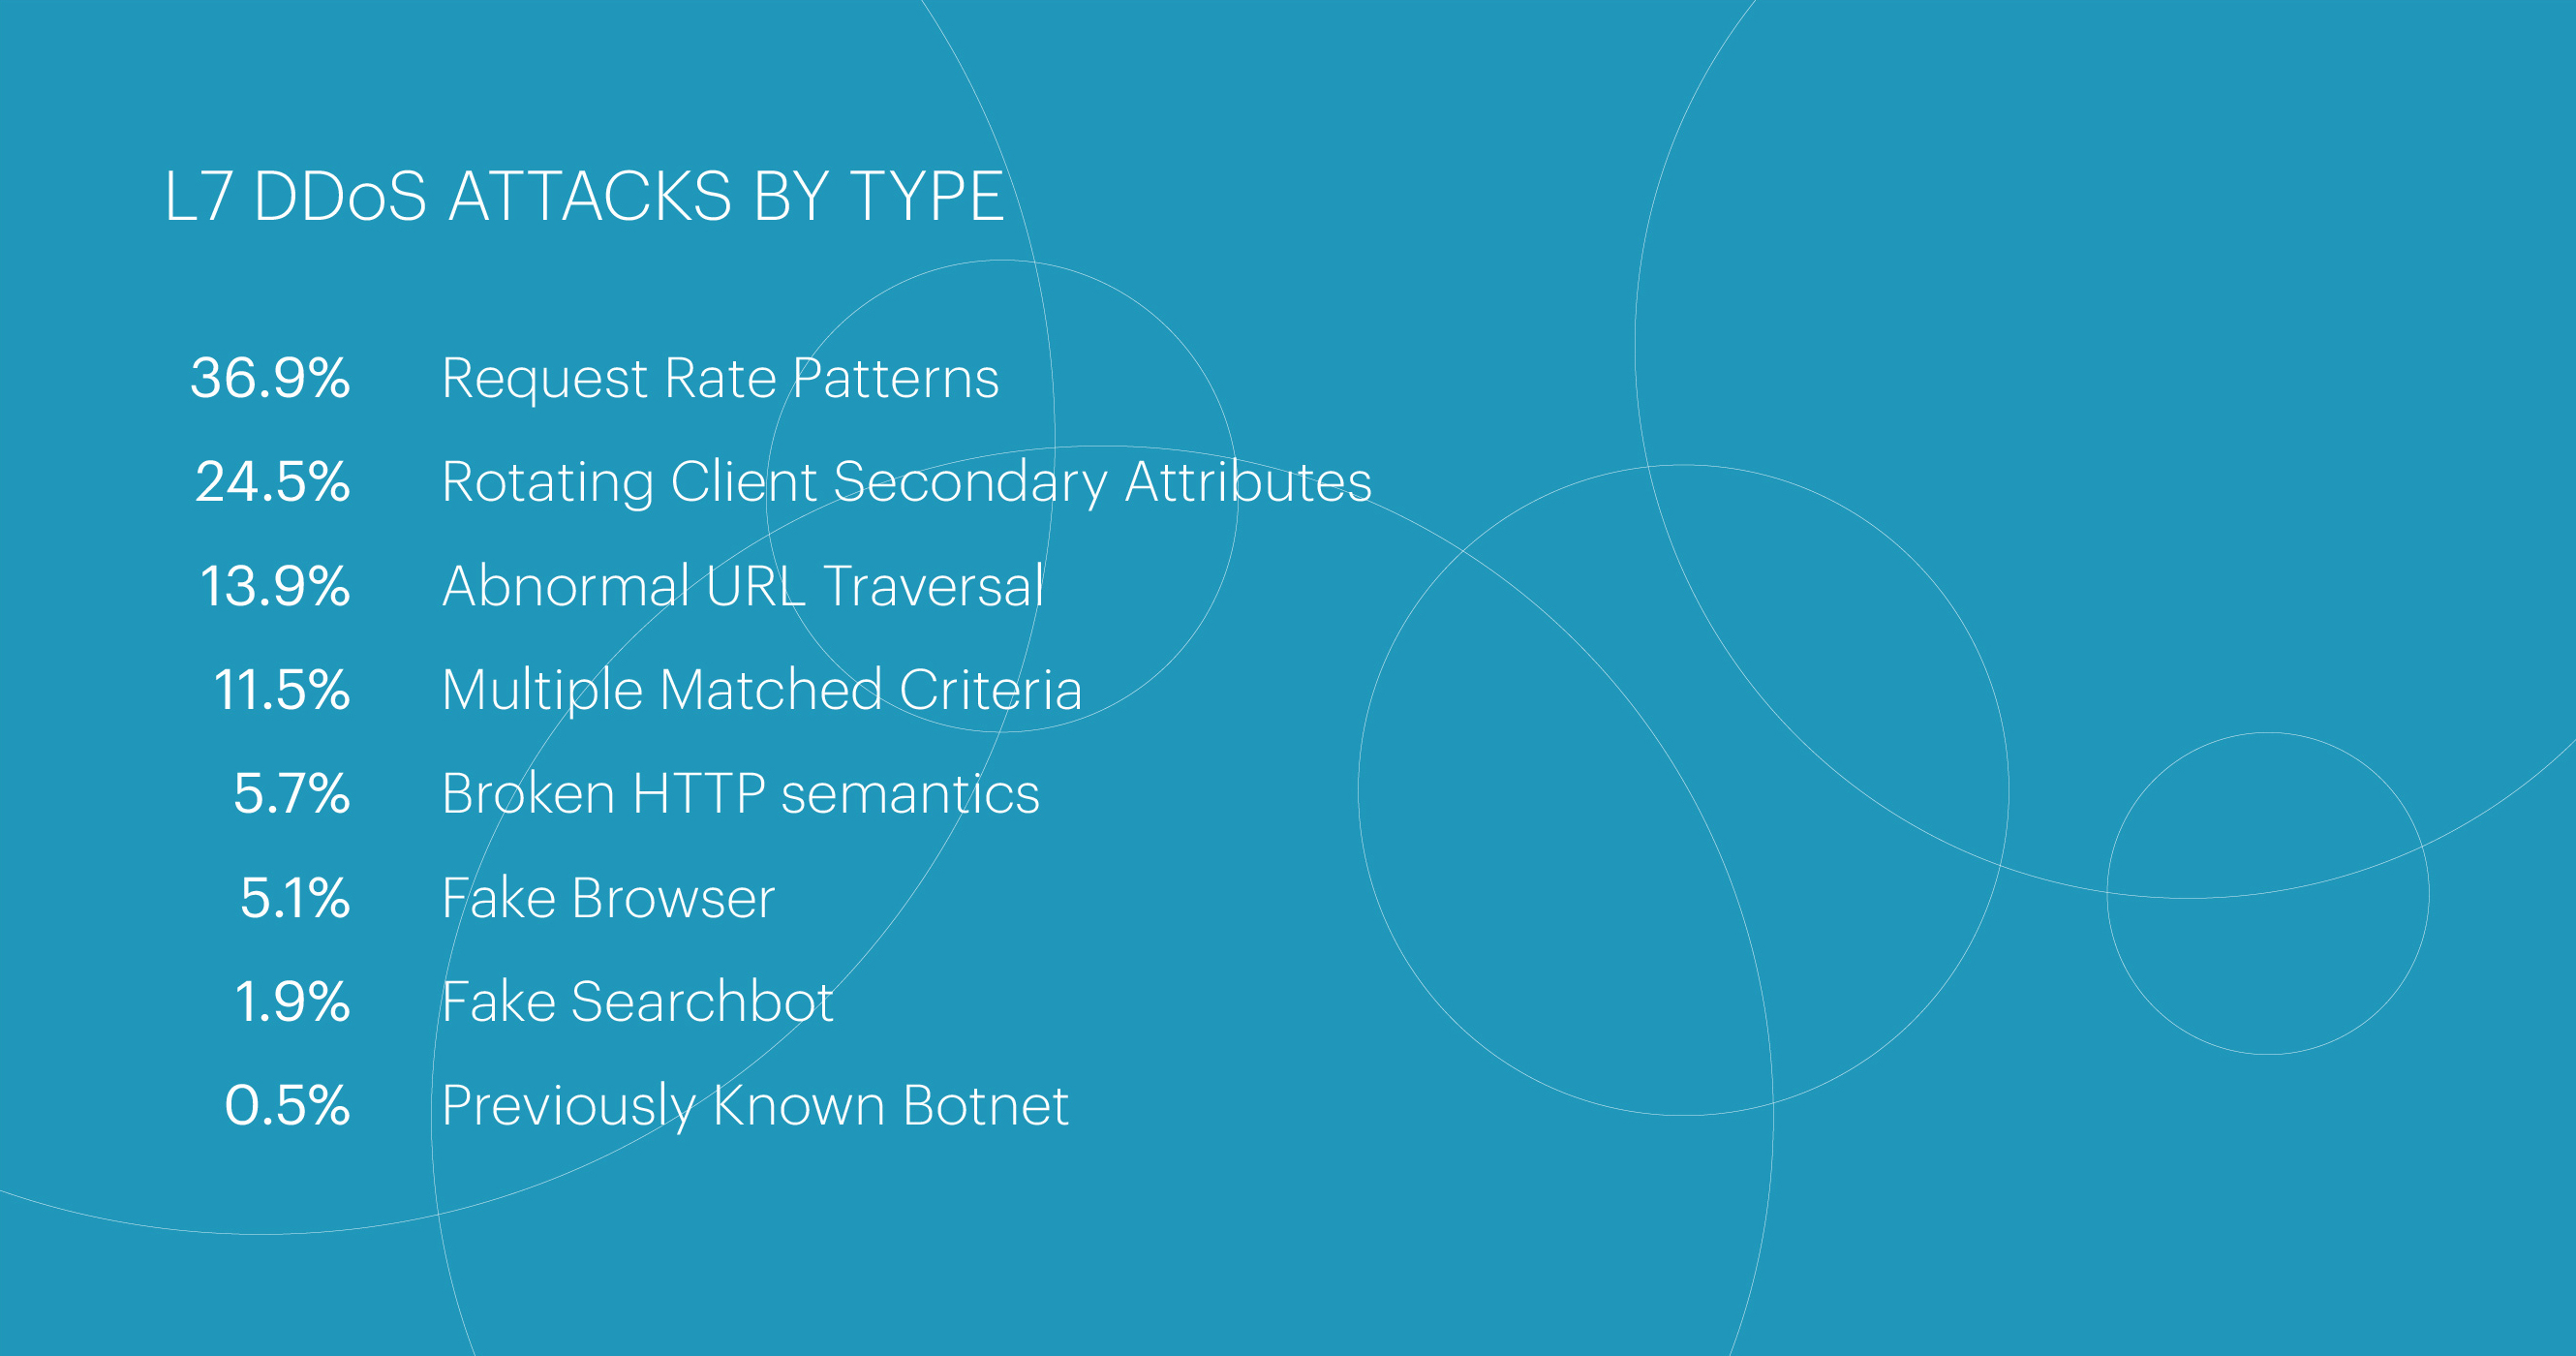
The top three classes of L7 attacks remained unchanged from the previous quarter. The most common were attacks classified as “Request Rate Patterns” (36.9%), characterized by request frequencies that deviate from the expected behavior of legitimate users.
In second place were “Rotating Client Secondary Attributes” attacks (24.5%), which involve unusual sets of request headers. The third most common were “Abnormal URL Traversal” attacks (13.9%), involving actions that legitimate users would typically not be able to perform.
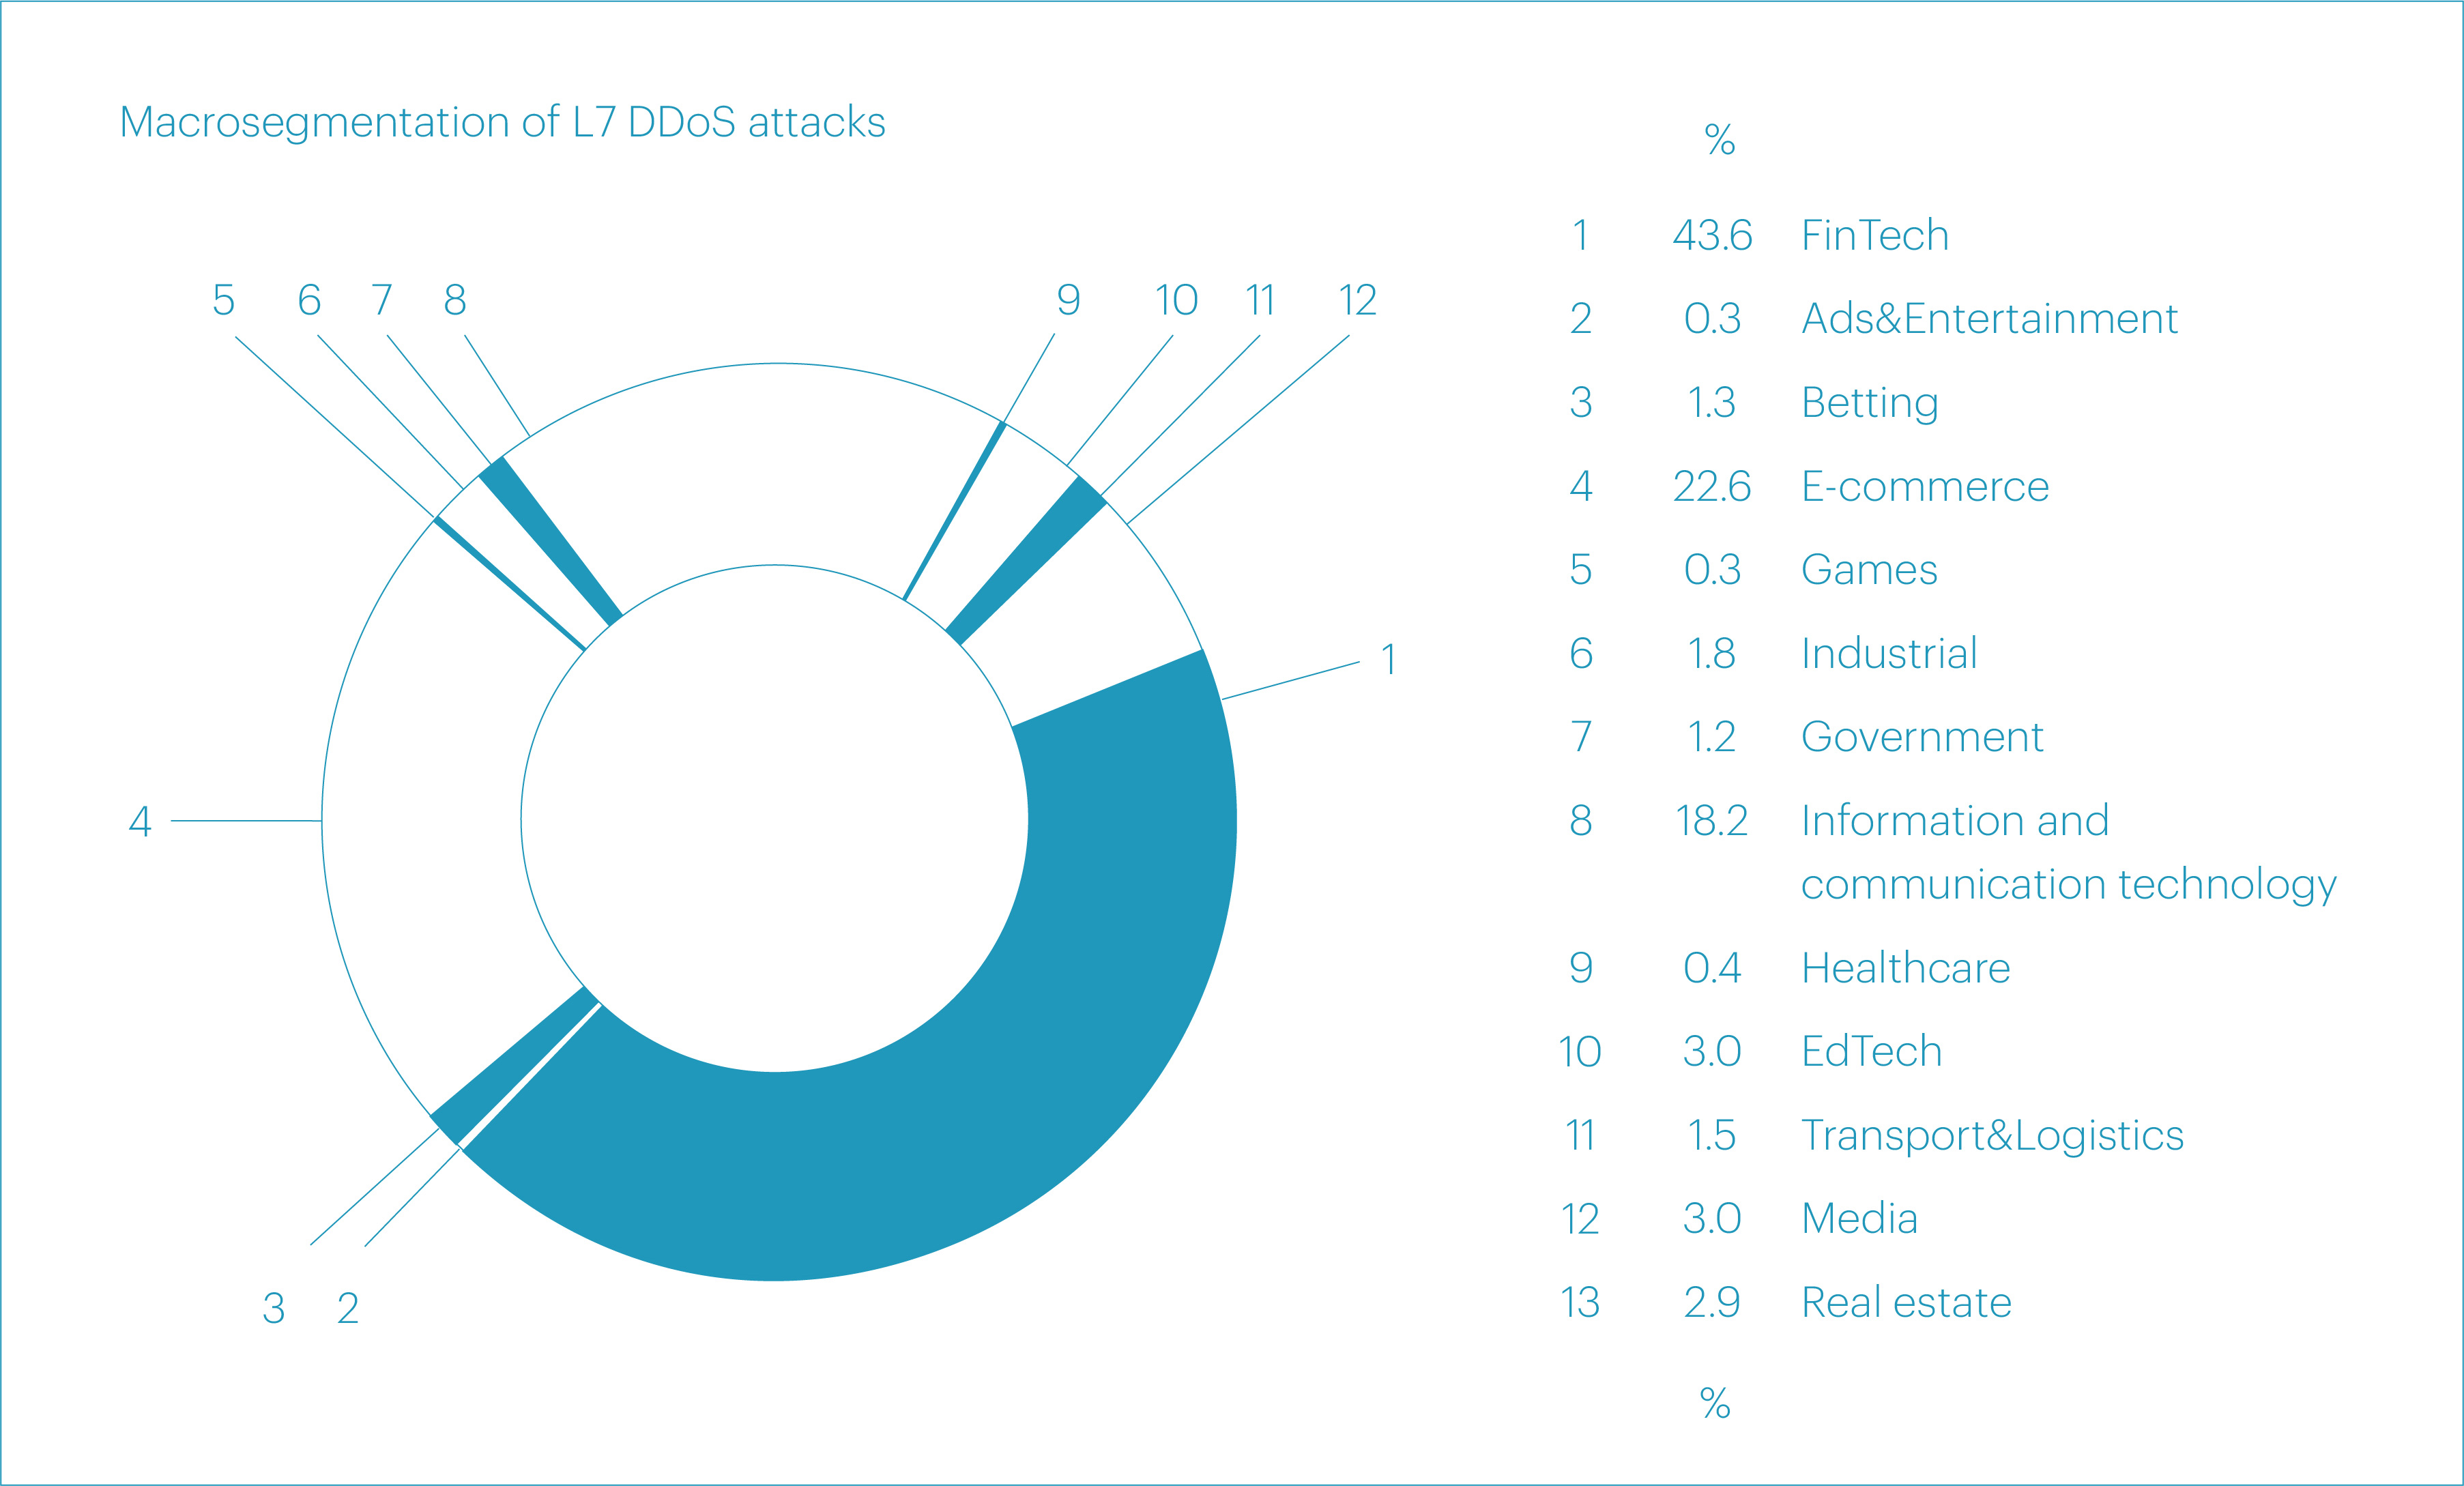
As in the previous several quarters, the largest share of L7 DDoS attacks in Q2 2025 targeted the “FinTech” macrosegment. However, its share declined significantly over the past year — from 56.8% in Q2 2024 to 43.6% in Q2 2025.
The second and the third positions also remained unchanged: “E-commerce” accounted for 22.6% of attacks, and “Information and communication technology” for 18.2%. Both shares grew noticeably compared to Q2 2024, when they stood at 13.8% and 7.8%, respectively.
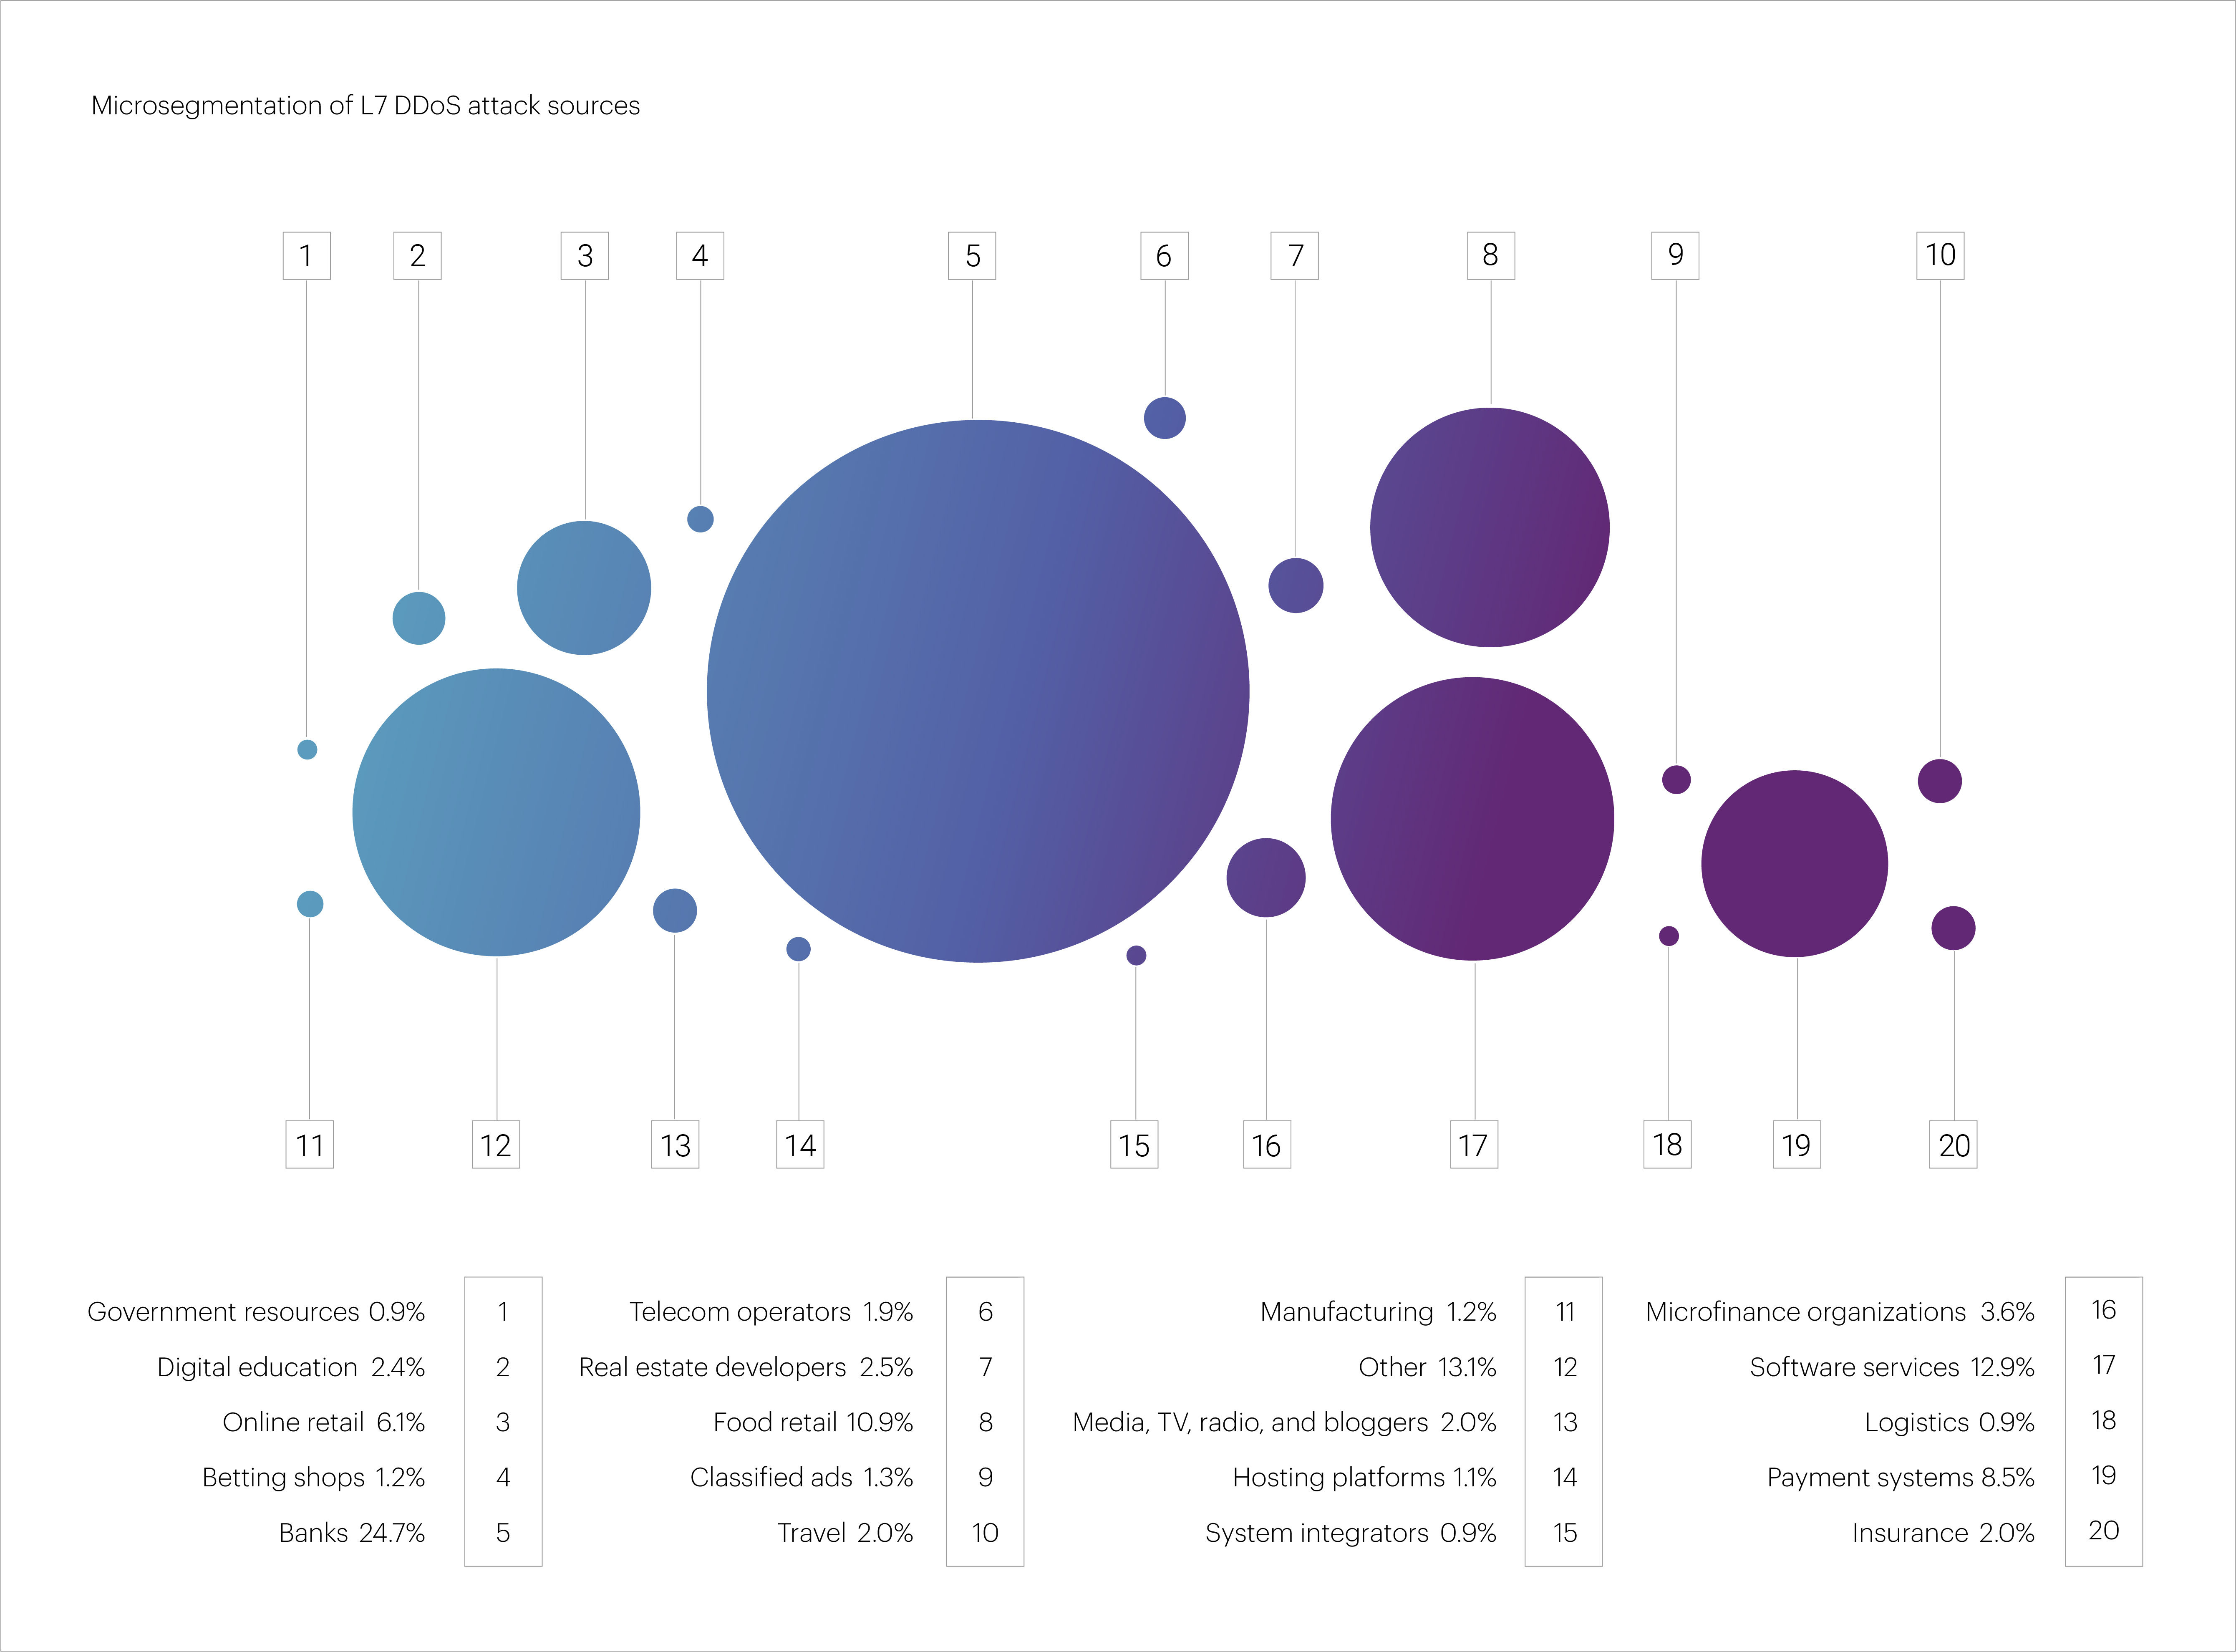
Looking at microsegments, the most frequently targeted in Q2 2025 were “Banks” (24.7%), though their share also declined year over year (from 32.2% in Q2 2024). A significant number of L7 DDoS attacks also targeted “Software services” (12.9%), “Food retail” (10.9%), “Payment systems” (8.5%), and “Online retail” (6.1%).
The top five longest L7 DDoS attacks recorded in Q2 2025 were as follows: the longest targeted the “Online retail” microsegment and lasted 65.5 hours.
Next were attacks against the “Logistics” (45.7 hours), “Telecom operators” (40 hours), “Software services” (17.2 hours), and “Media, TV, radio, and bloggers” (15.9 hours) microsegments.
For comparison, the longest L7 incident in all of 2024 lasted 49 hours. Thus, one attack in Q2 2025 significantly exceeded this record, while two others came close to it.
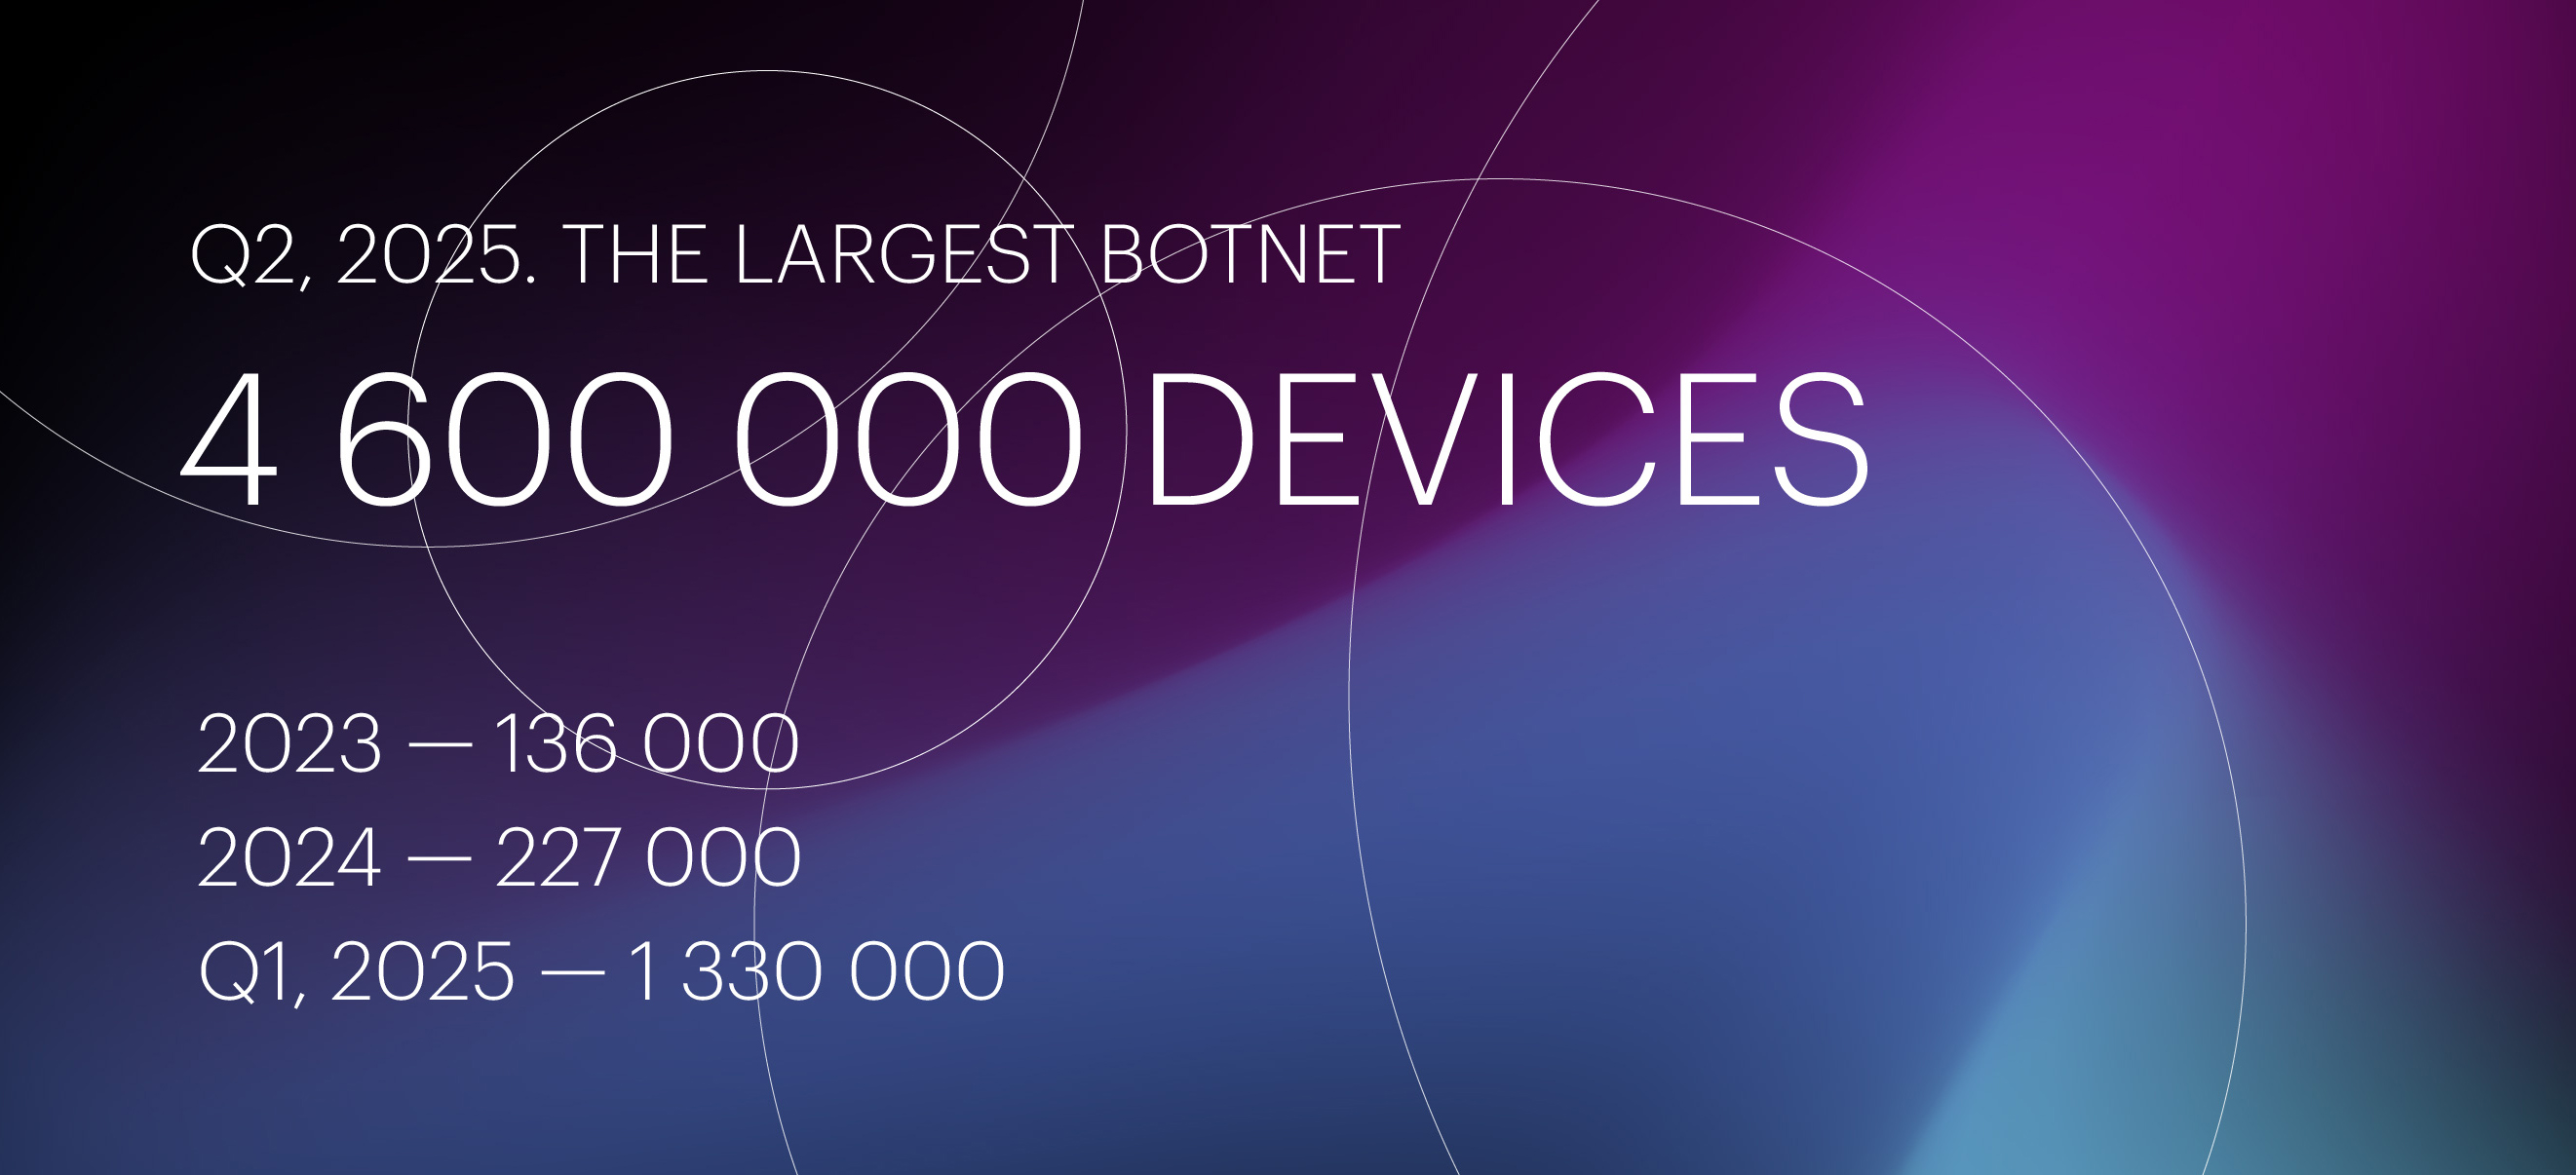
At the end of the previous quarter, on March 26, 2025, we recorded an attack by the largest DDoS botnet to date, consisting of 1.33 million devices, most of which were located in Brazil (51%), as well as in Argentina, Russia, Iraq, Mexico, and several other countries.
In the middle of Q2, on May 16, 2025, we observed another attack by this botnet. This time, it involved 3.5 times more devices: in total, we blocked approximately 4.6 million unique IP addresses during the mitigation of this attack. This is roughly 20 times larger than the biggest botnet we detected in 2024 (227,000 devices) and almost 34 times larger than the 2023 record (136,000 devices).
The attack targeted an organization in the “Government resources” segment, lasted just over an hour, and unfolded in several phases:
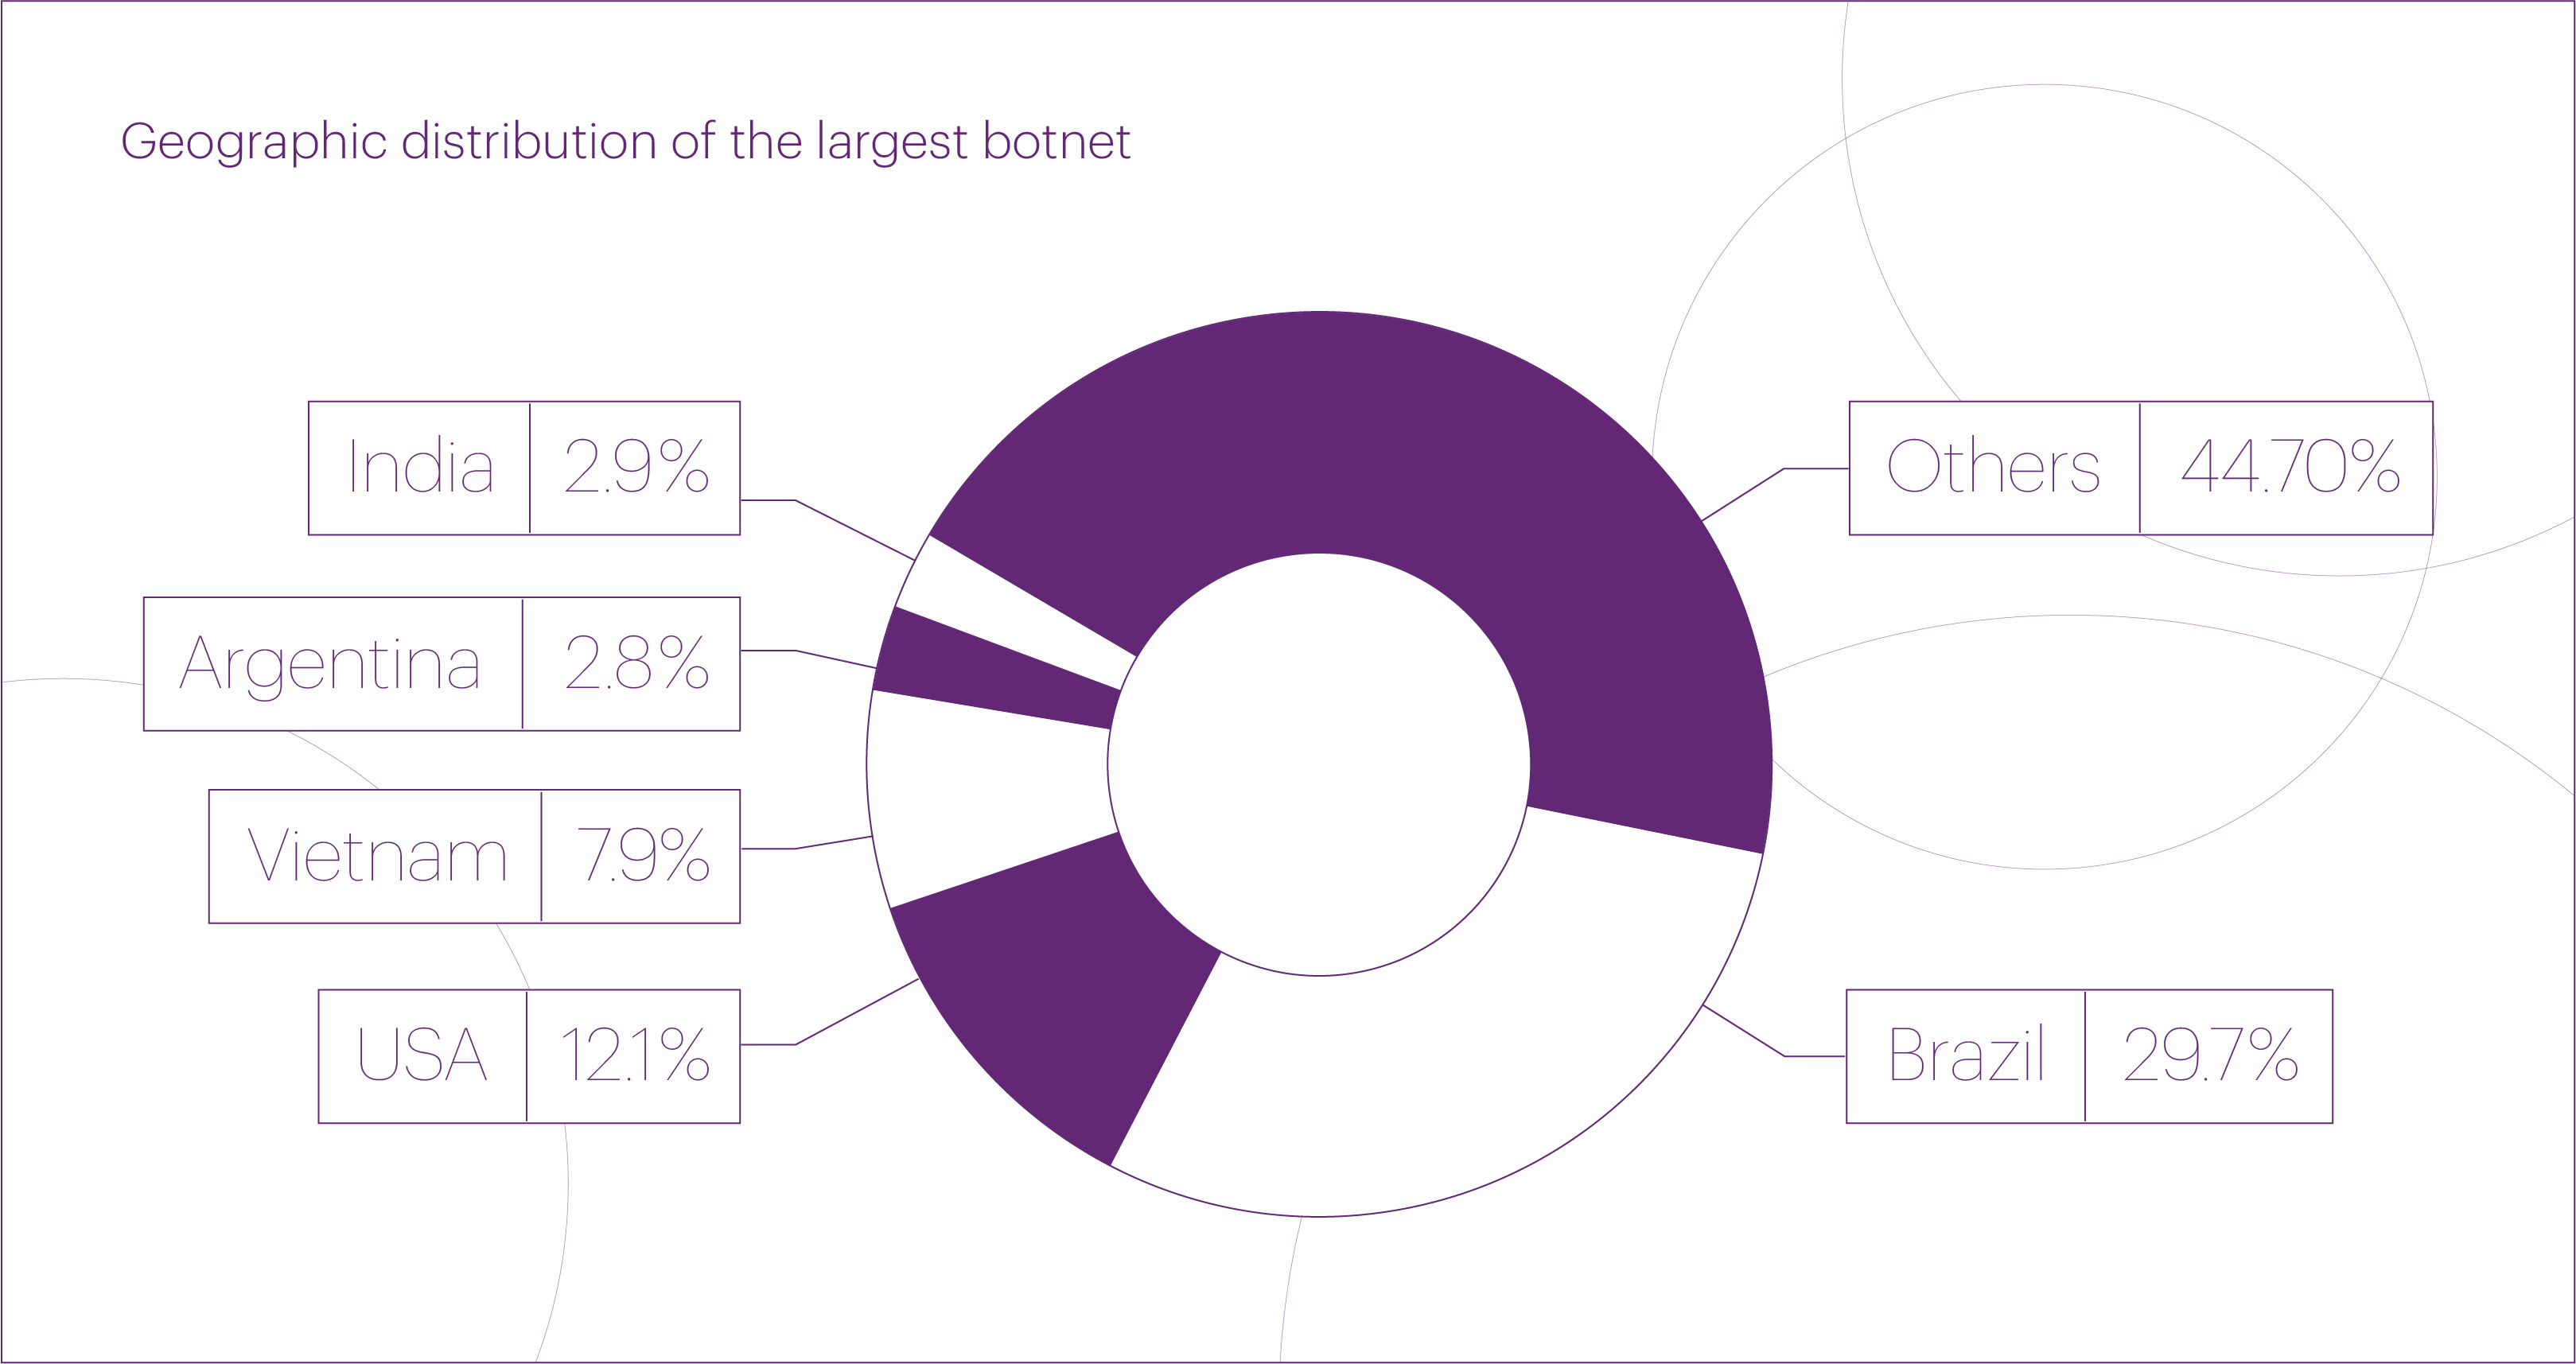
The botnet’s geography became noticeably more diverse in the month and a half between these two incidents: although IP addresses from Brazil still dominated, their share decreased from 51% to 30%. We also blocked a significant number of IP addresses from the United States (12.1%), Vietnam (7.9%), India (2.9%), and Argentina (2.8%). At the same time, the share of other countries increased significantly — from 33% in March to around 45% in May.
In Q2 2025, the countries most frequently serving as sources of application-layer (L7) DDoS attacks were led by Russia (17%) and the United States (16.6%), with their shares nearly equal. Brazil firmly held third place with 13.2%, showing a significant increase over the past year.
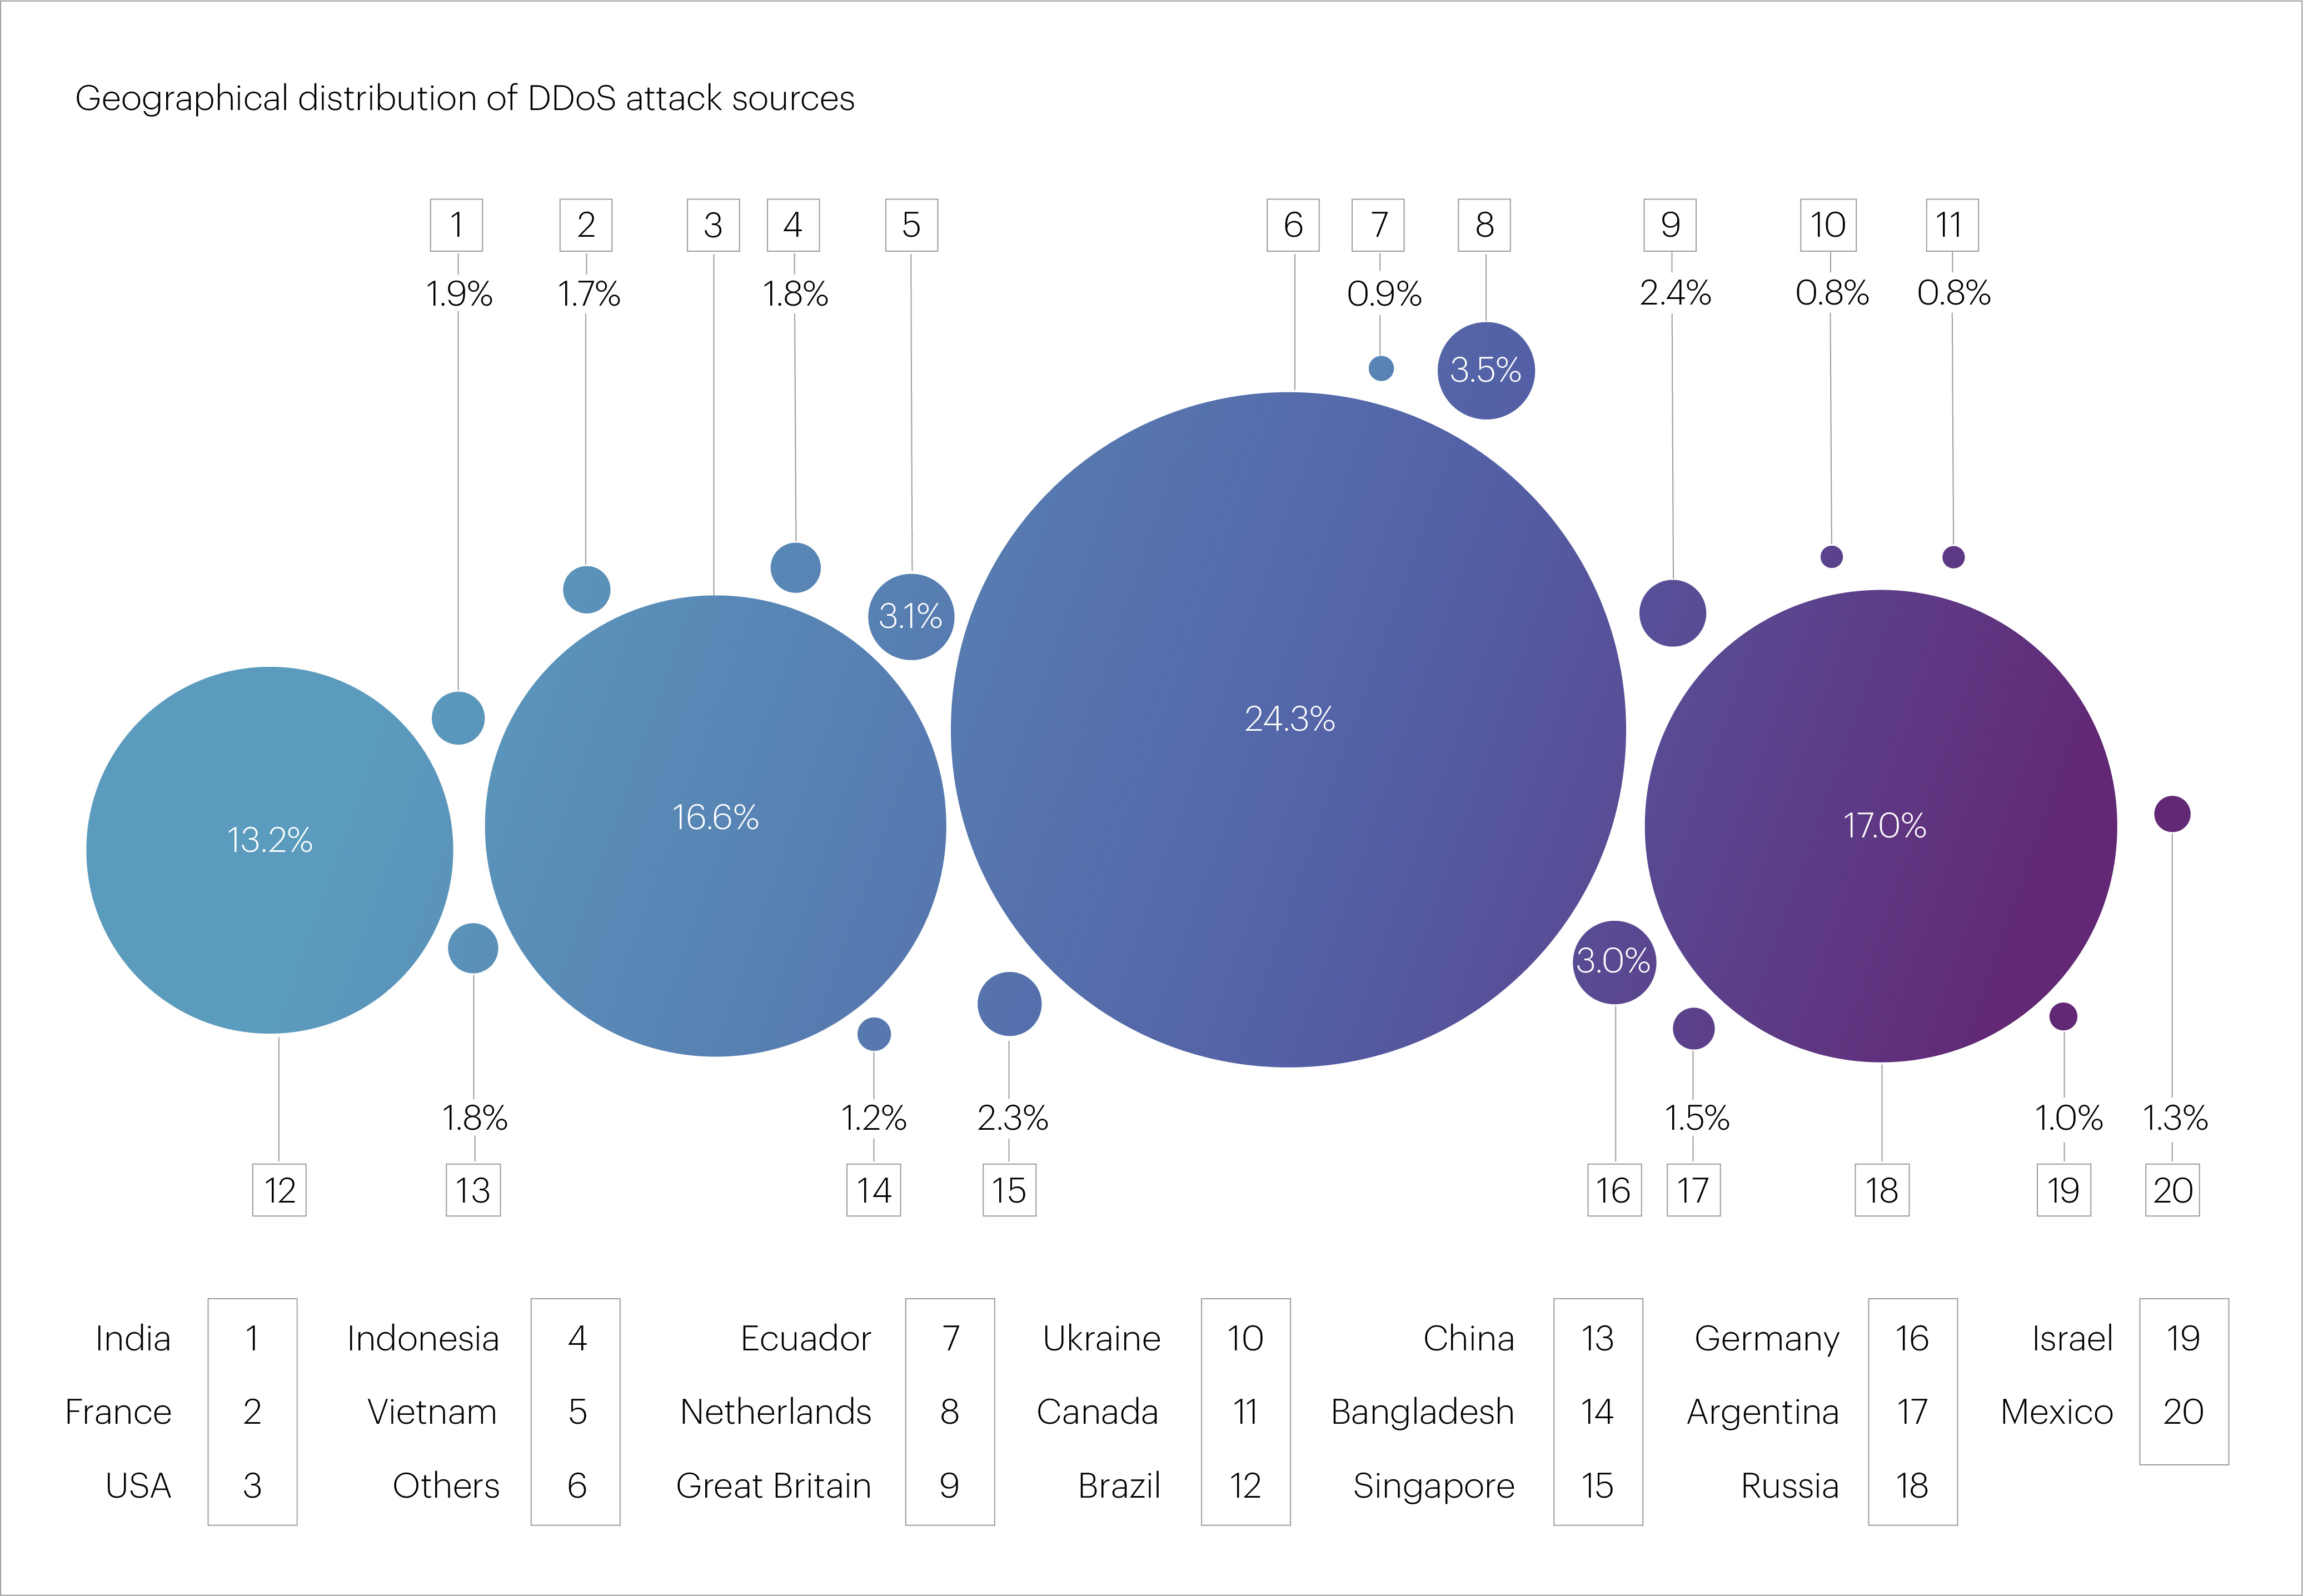
Also making the top ten sources of malicious traffic were the Netherlands (3.5%), Vietnam (3.1%), Germany (3%), the United Kingdom (2.4%), Singapore (2.3%), India (1.9%), and China (1.8%). Together, these ten countries accounted for approximately two-thirds (64.8%) of all IP addresses we blocked during DDoS mitigation in Q2 2025.
To avoid confusion, it’s important to clarify that “bad bots” refer to automated systems that attempt to interact with websites while pretending to be legitimate users. Unlike destructive DDoS bots, bad bots do not aim to disrupt a site’s functionality. Their goals typically include data scraping, artificially inflating metrics, brute-forcing accounts, and other unwanted activities.
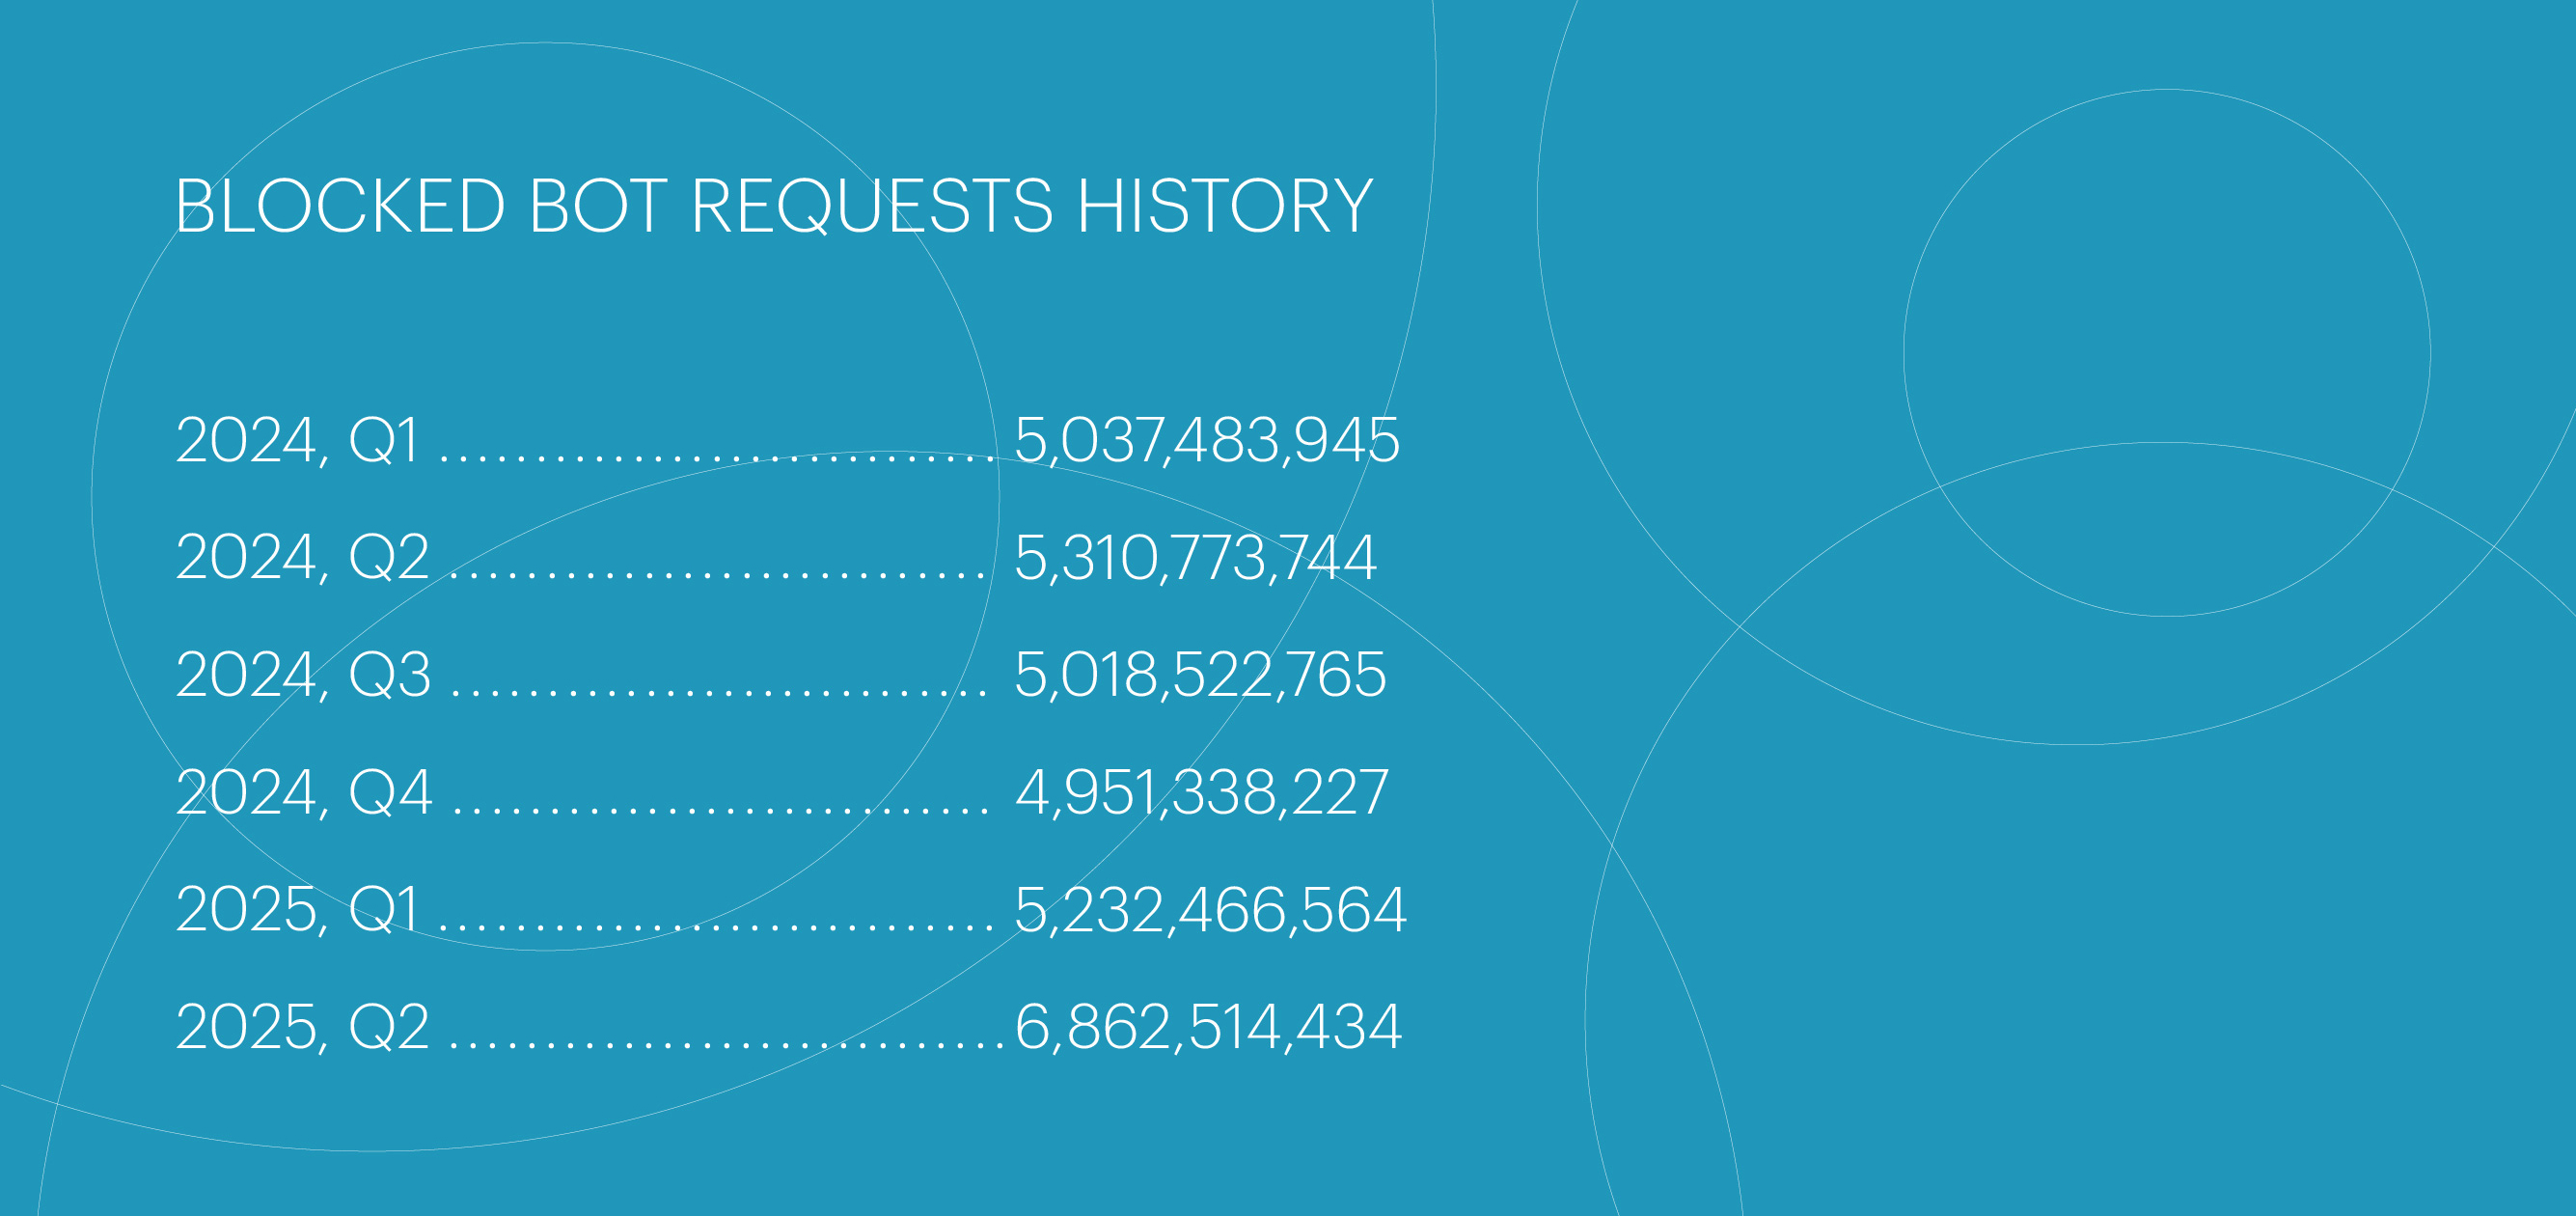
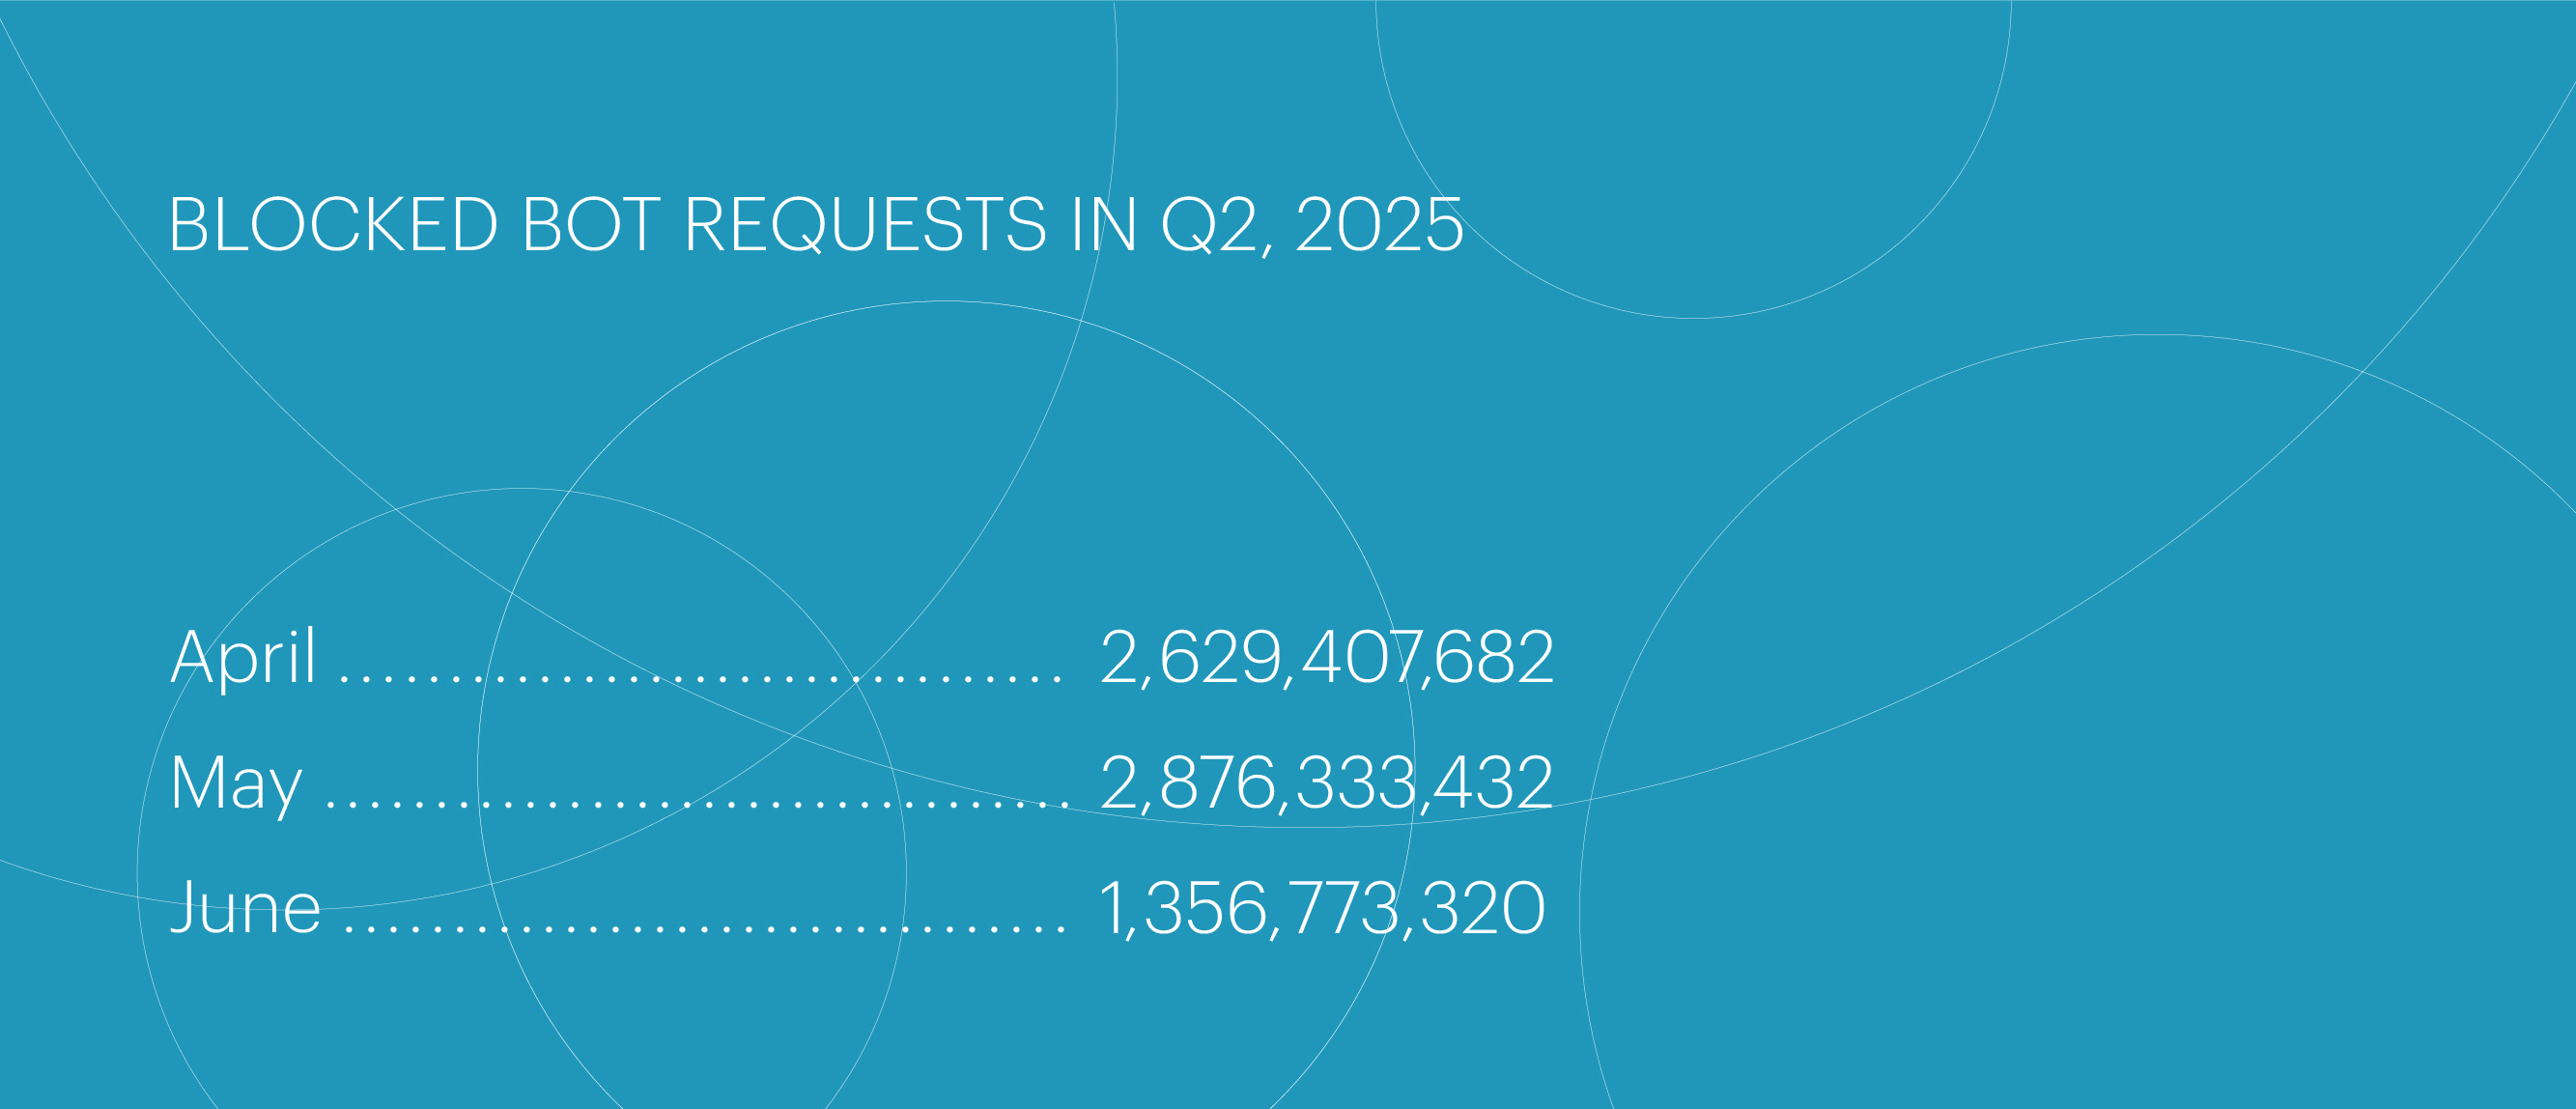
In Q2 2025, we observed a sharp rise in bad bot traffic (+31%), significantly outpacing the growth in the number of protected resources.
The surge in bot traffic peaked in April–May, followed by a decline in June. This spike was largely driven by the longest-lasting bot attack of the quarter, which we will cover later.
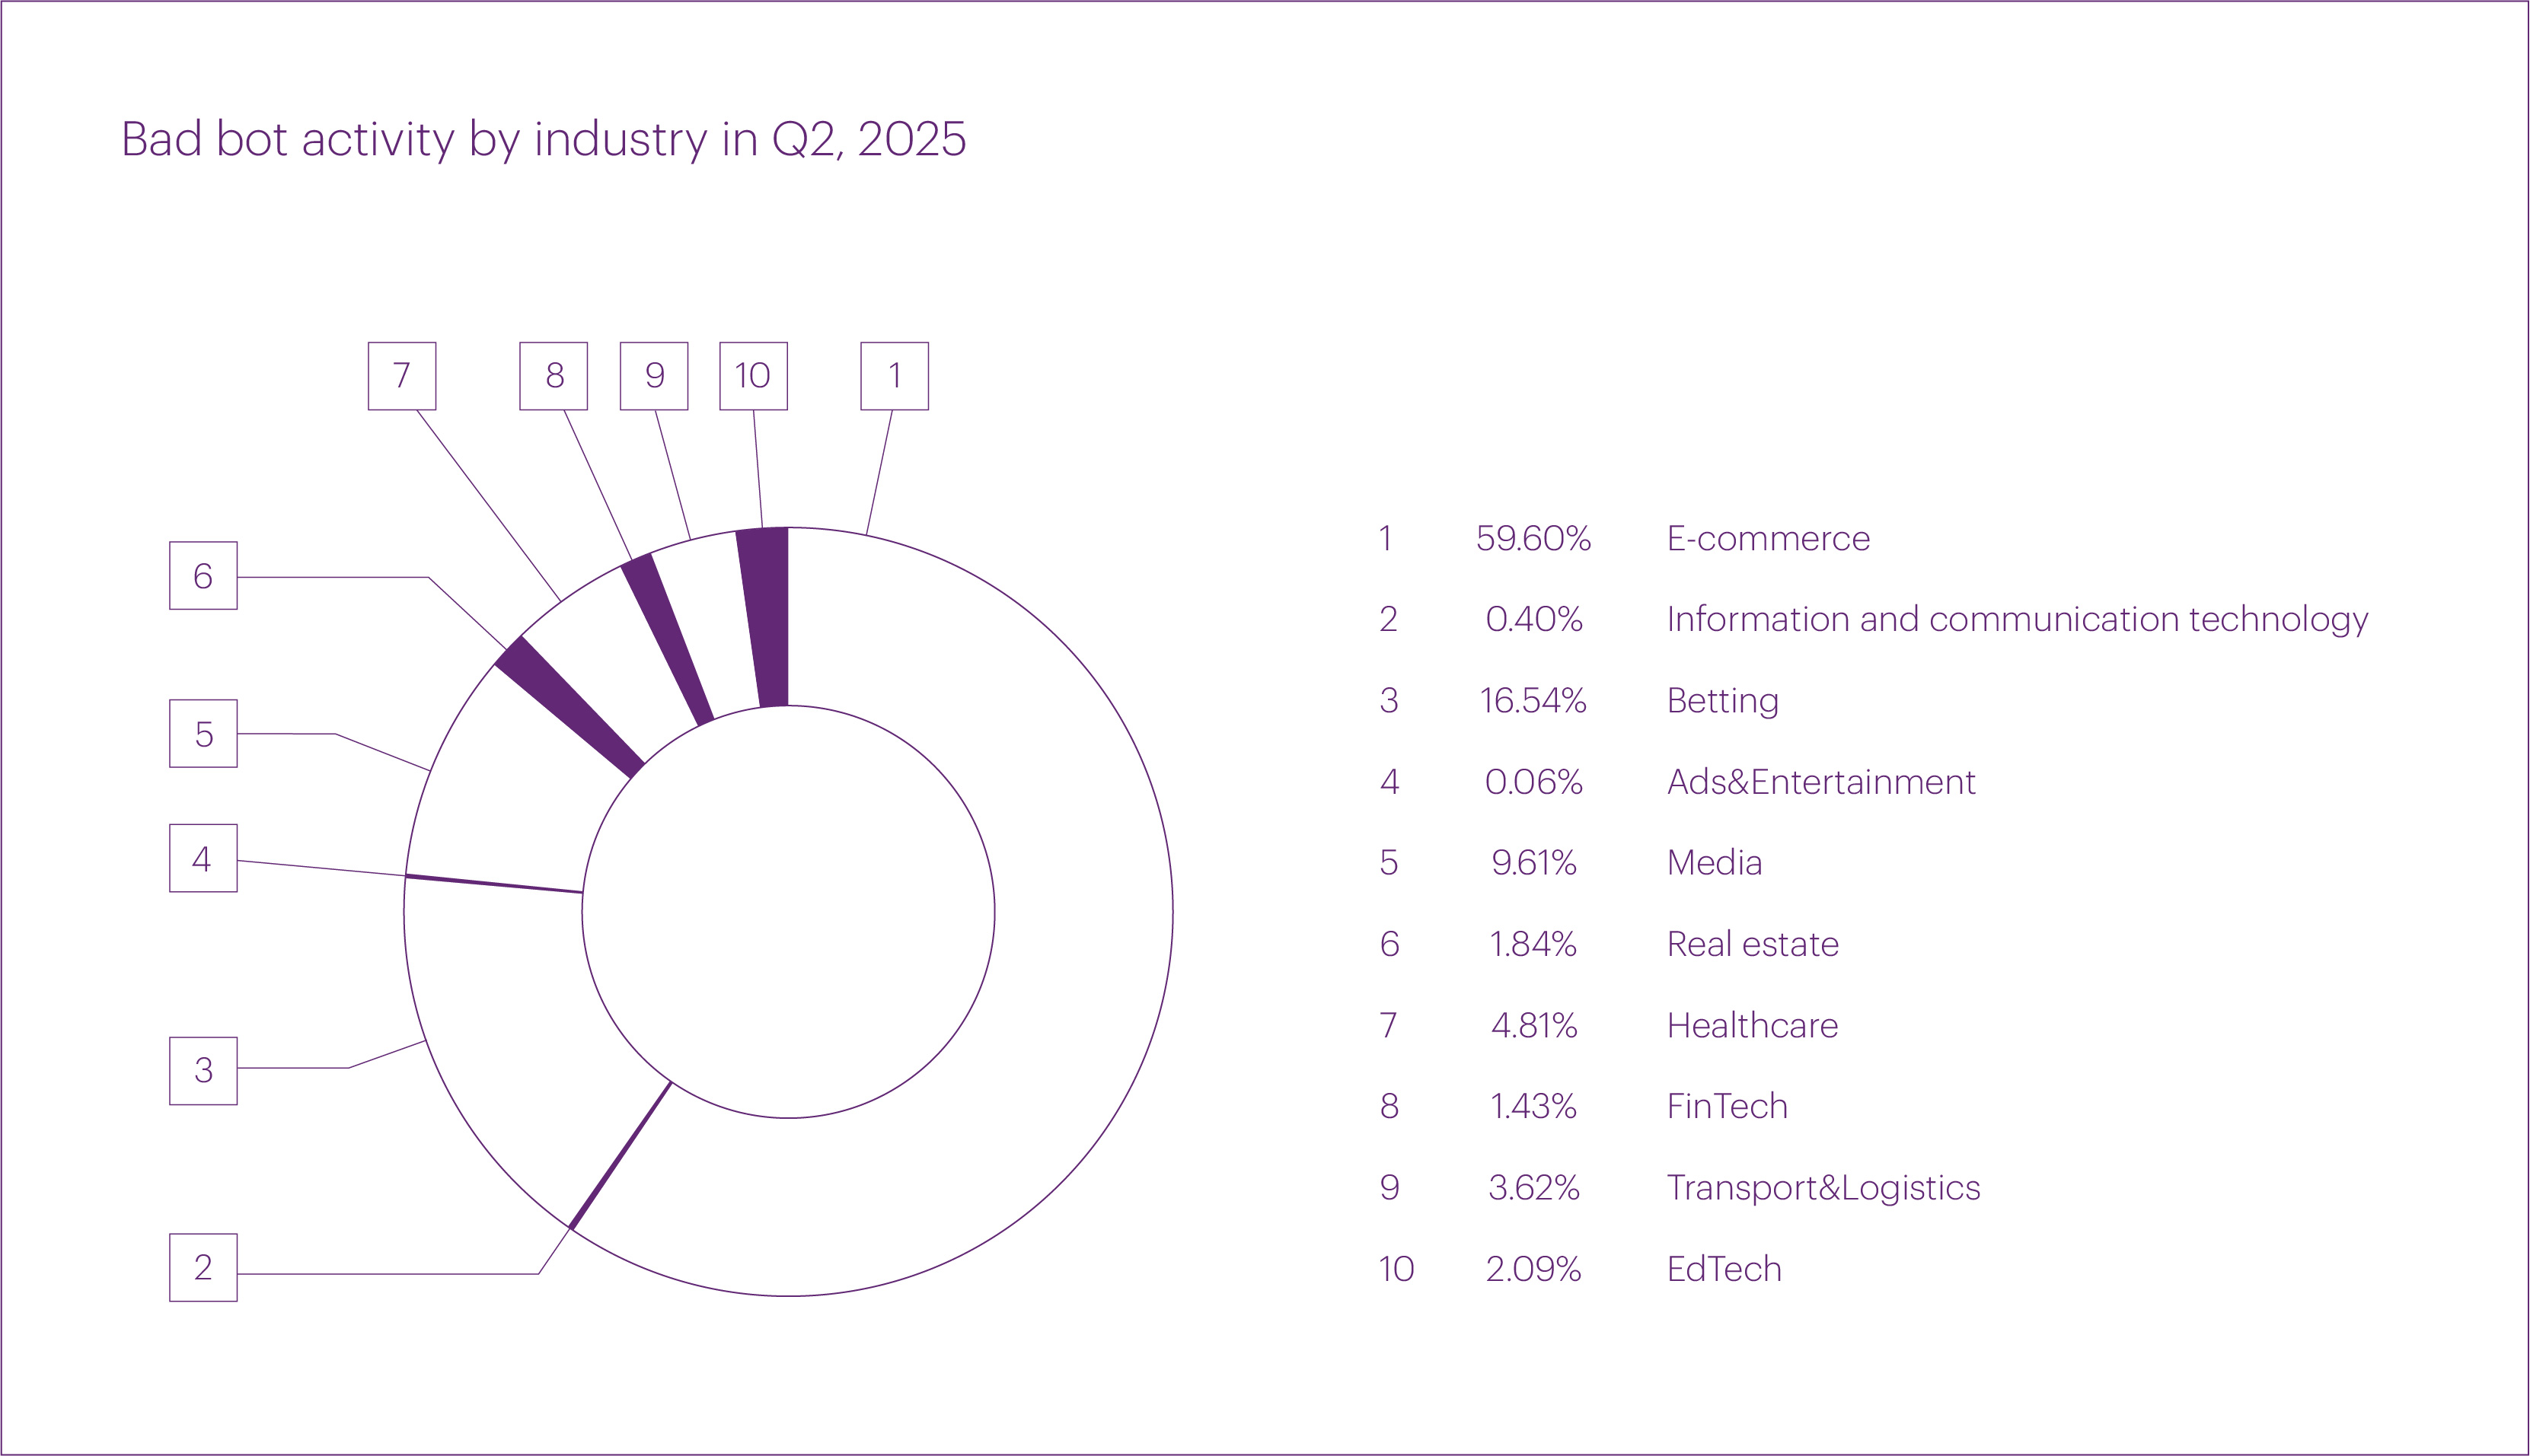
Most bad bot attacks in Q2 2025 targeted the “E-commerce” segment, with its share rising to 59.6%. Far behind were “Betting” (16.5%) and “Media” (9.6%). Combined, these three segments accounted for more than 85% of all bad bot traffic during the quarter.
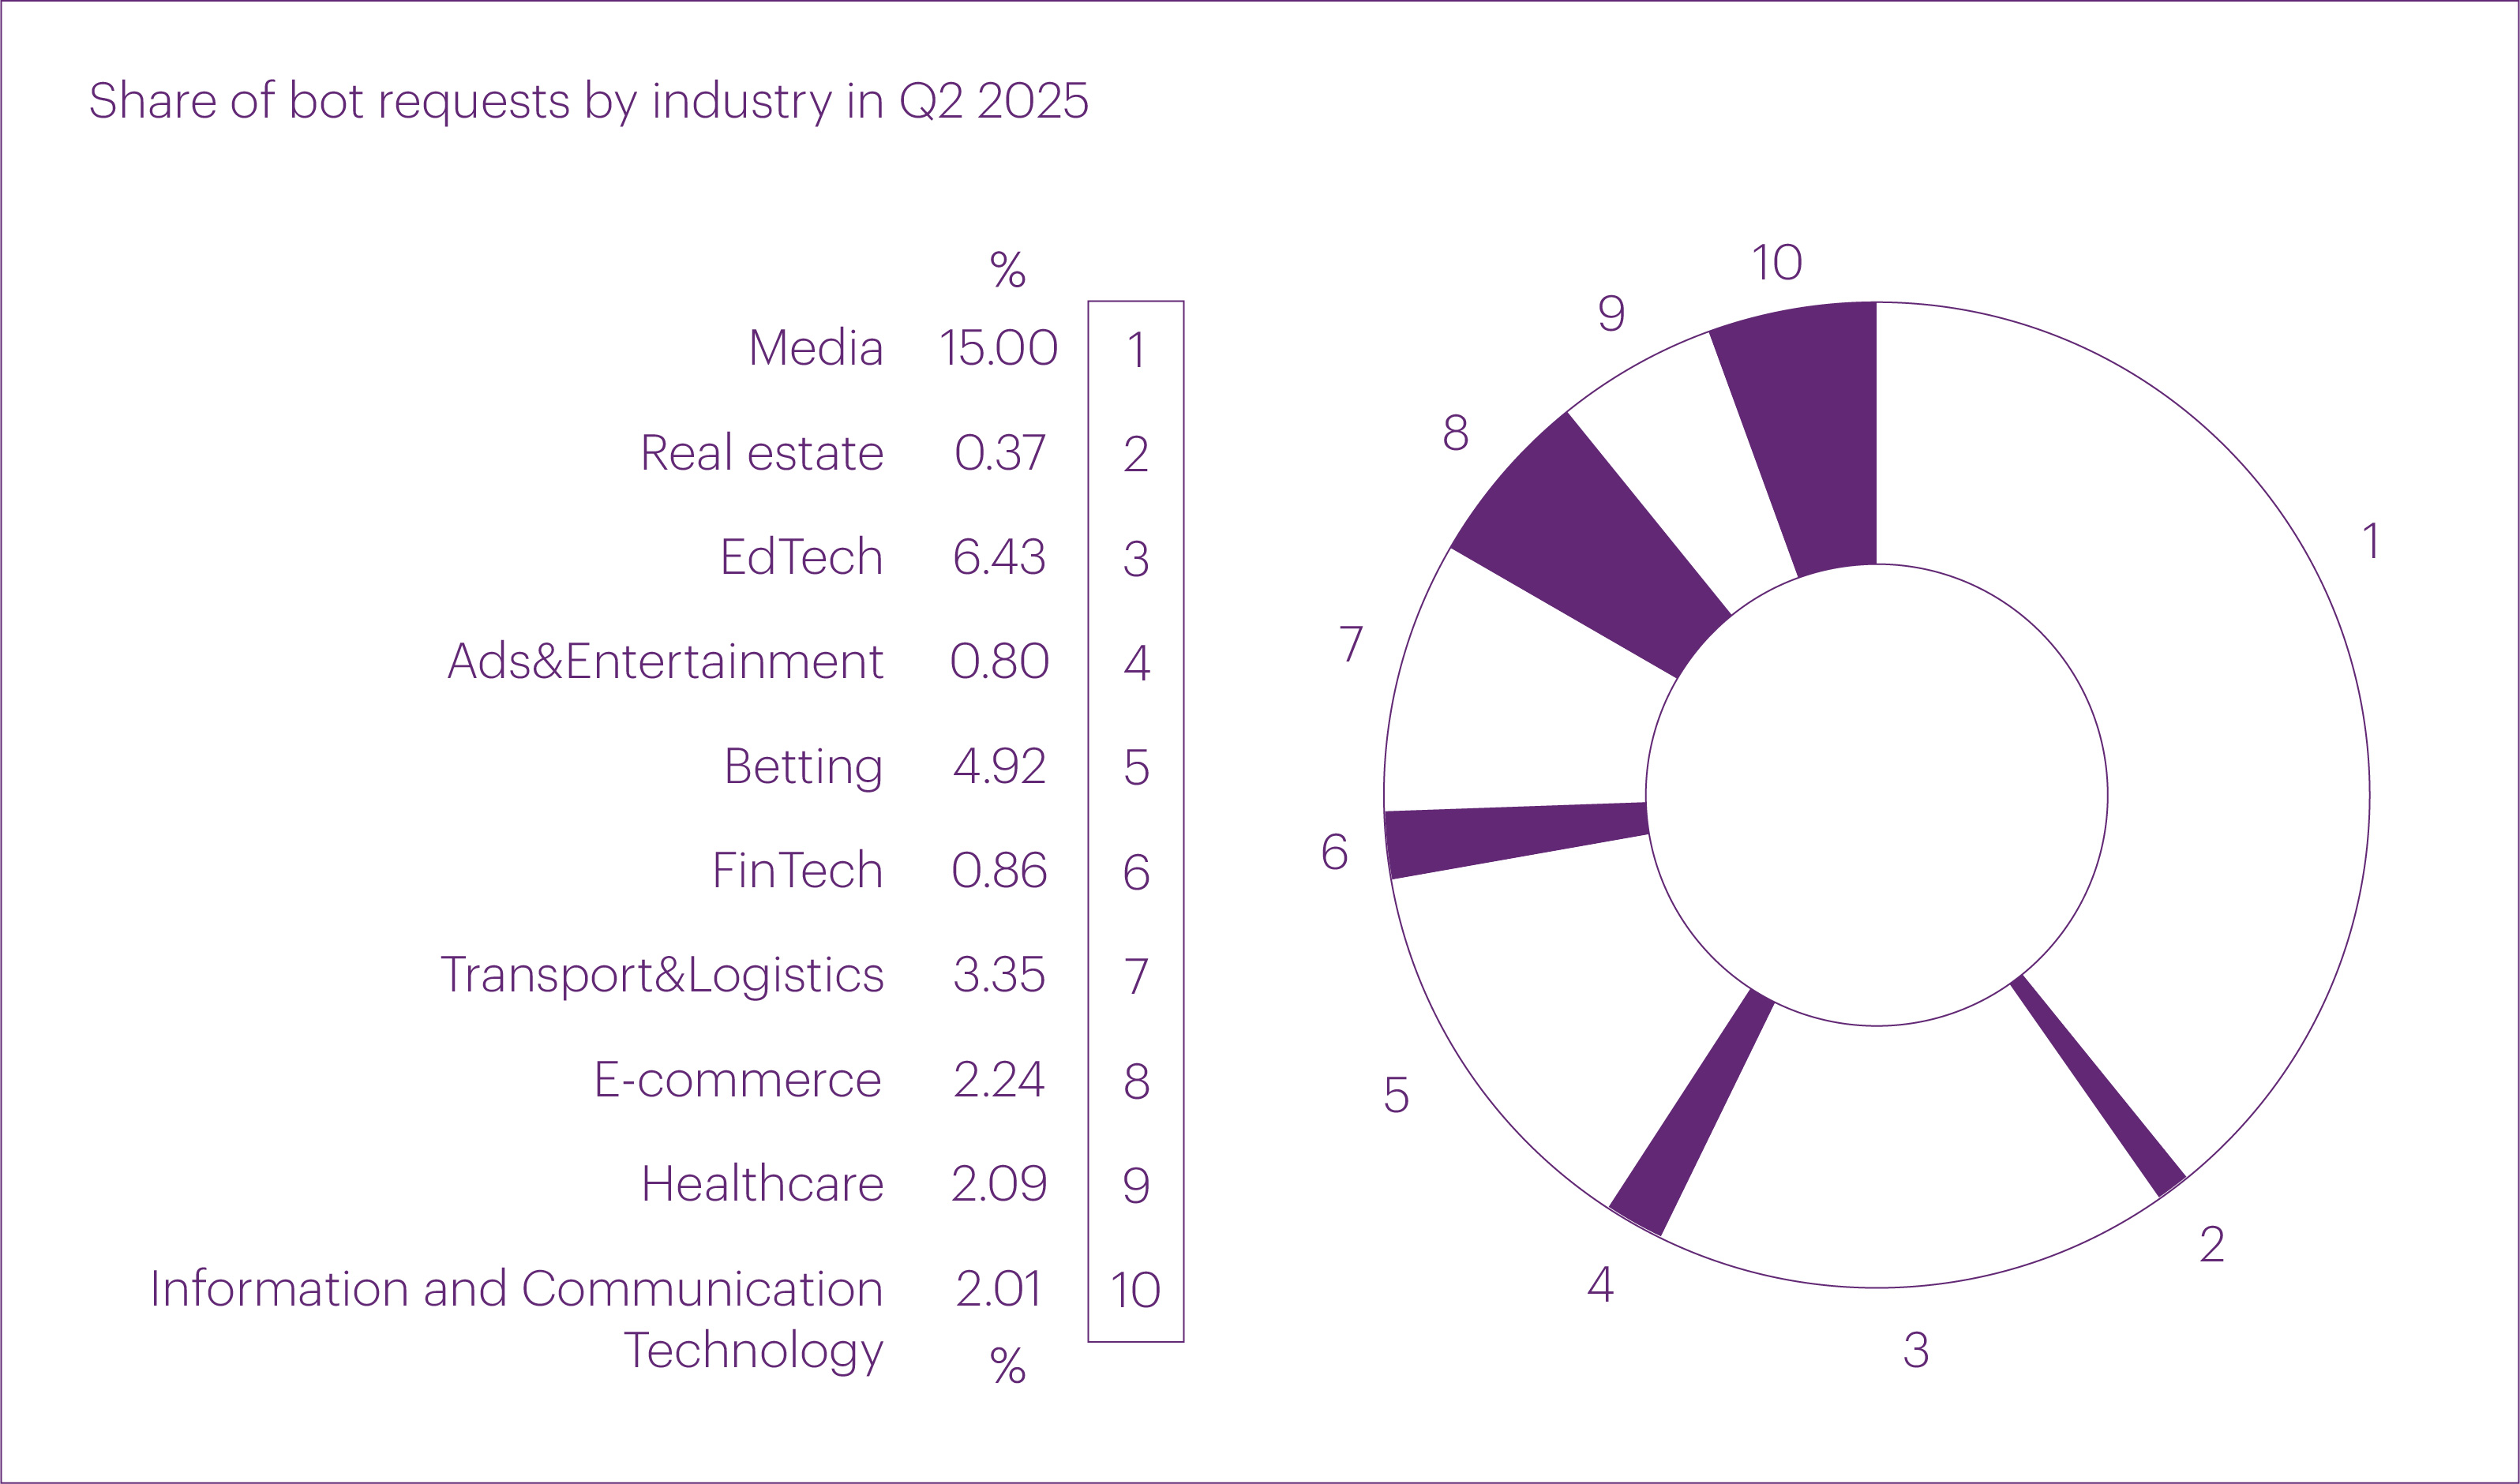
Starting this quarter, we also began analyzing the share of bad bot traffic relative to total traffic across protected resources — essentially, a “bad bot index.” According to our analytics system, this index averaged 2.34% in Q2 2025.
Interestingly, the botness index varied significantly across industries. The three segments most exposed to bot traffic were: “Media” (15%), “EdTech” (6.4%), and “Betting” (4.9%).
It’s worth noting that Qrator.AntiBot allows customers to configure on which pages and domains bot protection is enabled. As a result, this statistic may not reflect a significant portion of overall bot traffic.
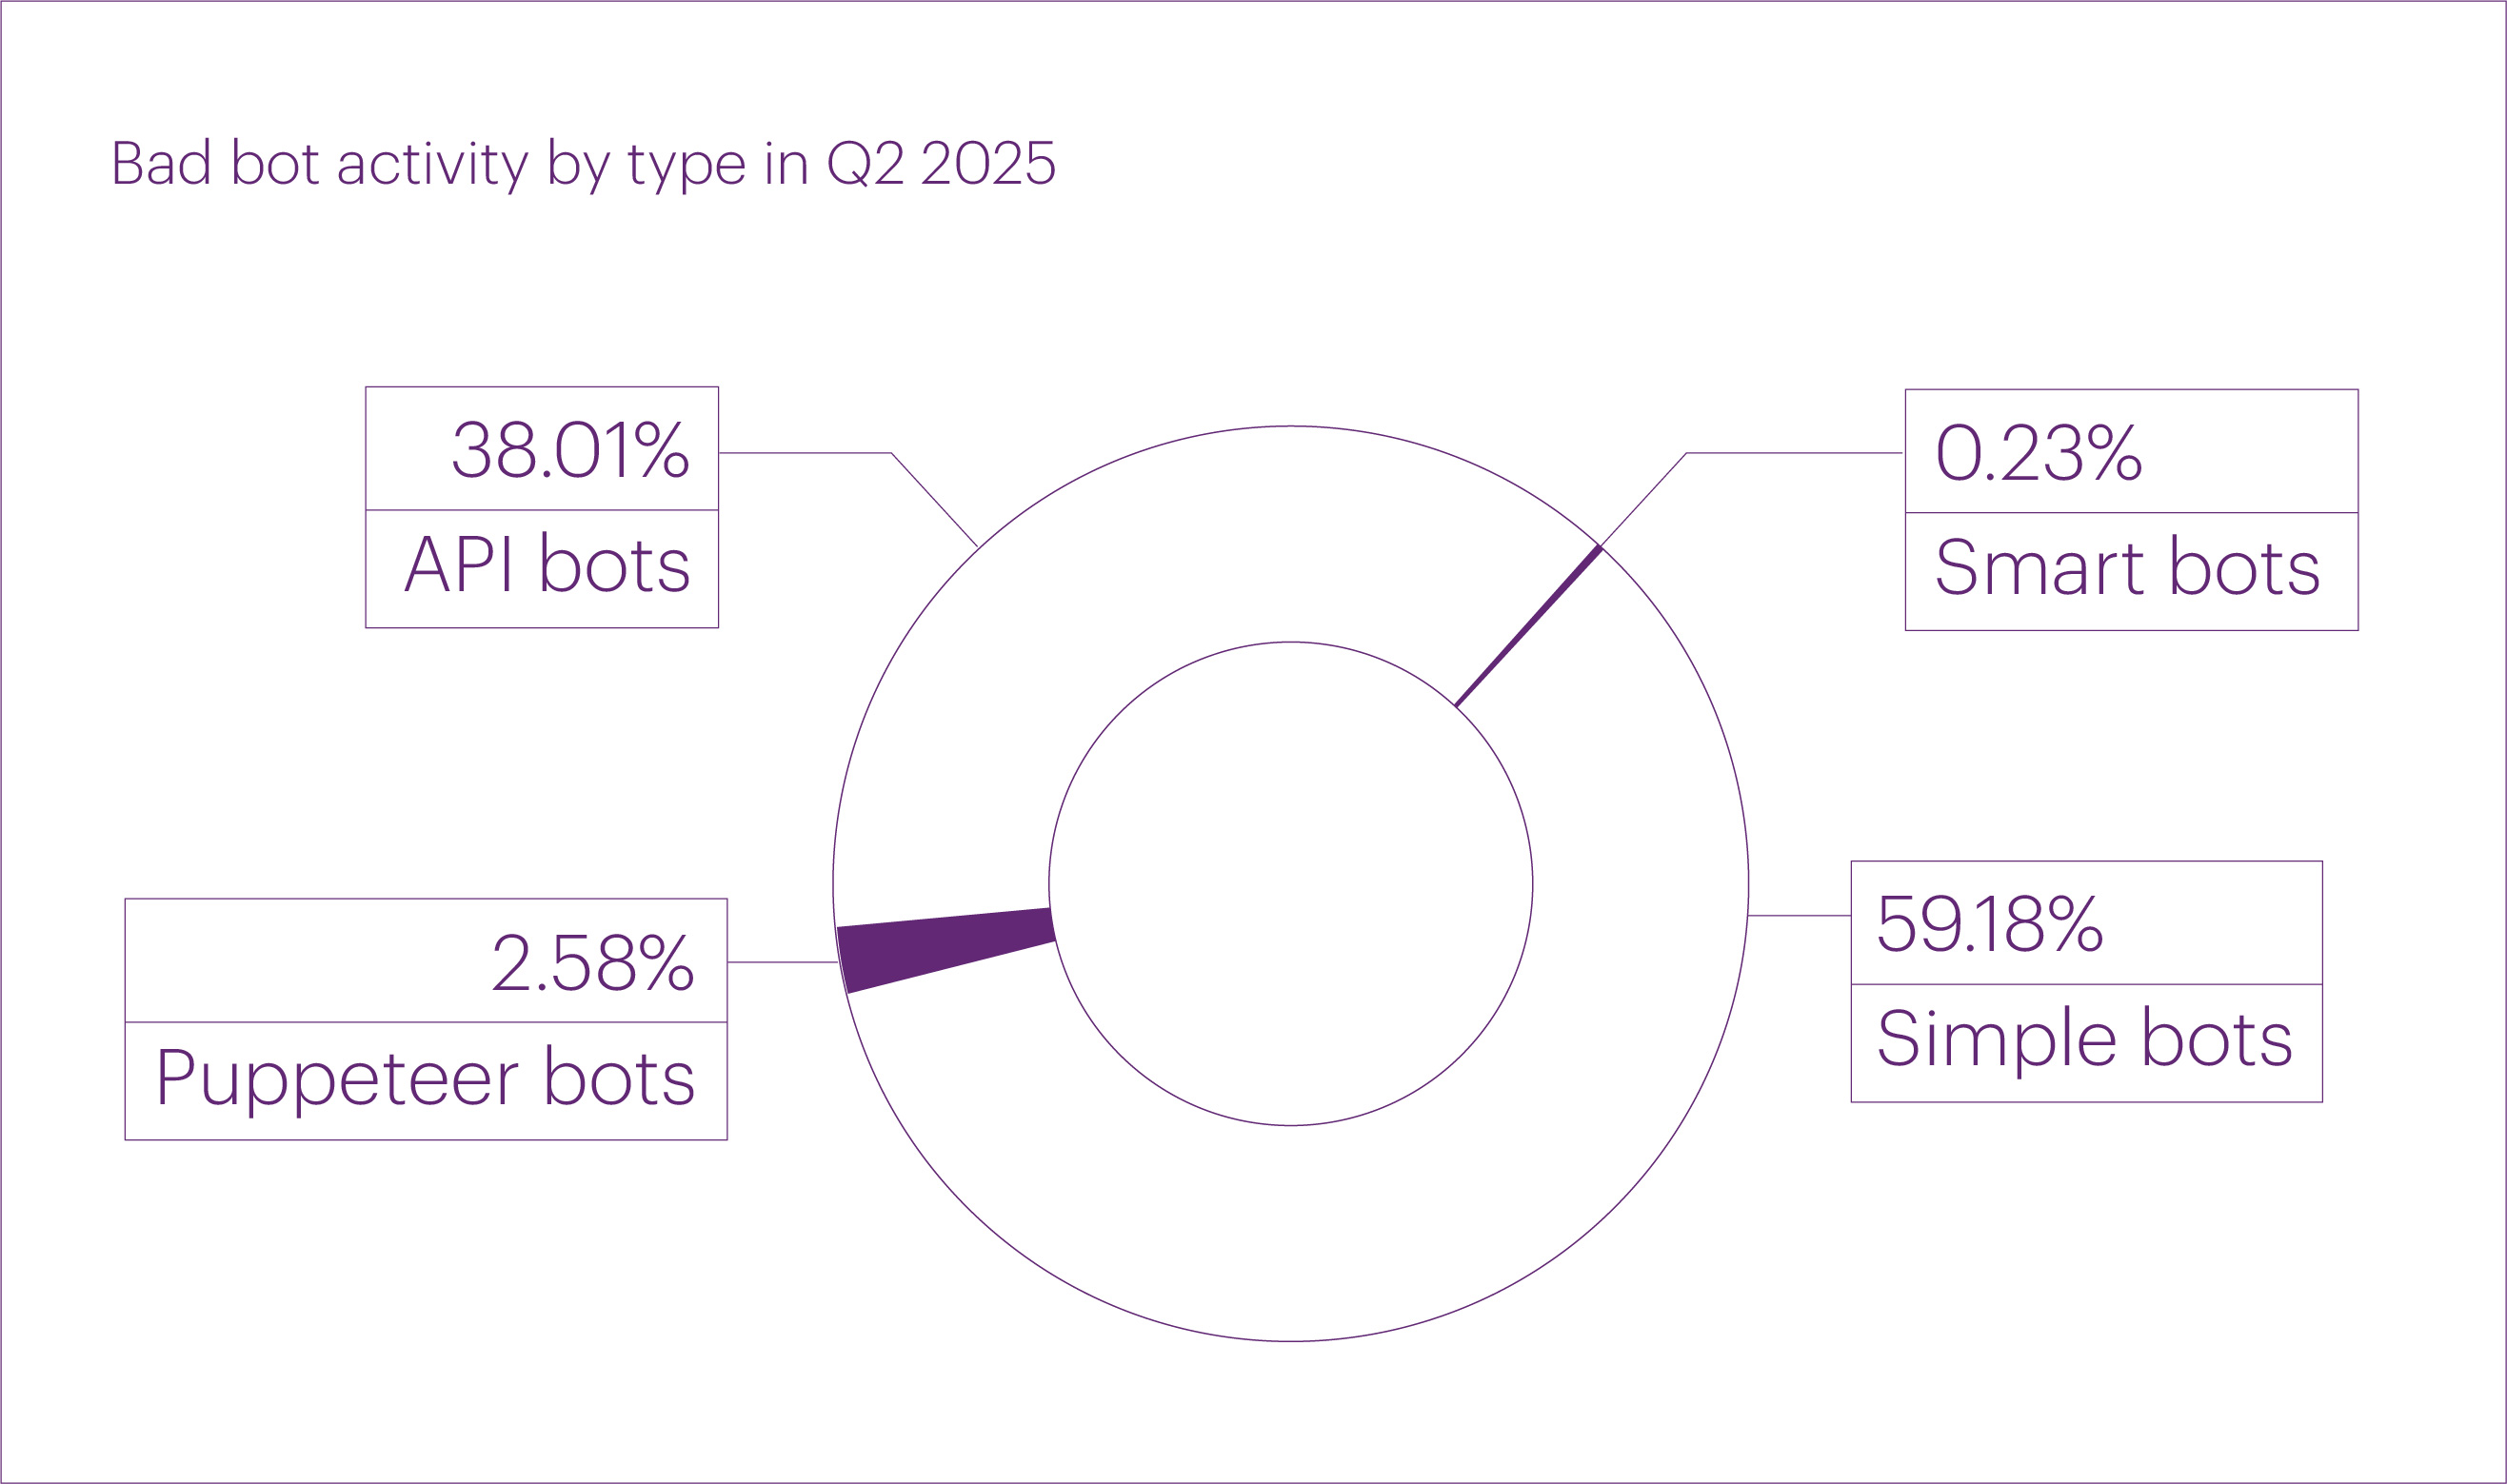
We also improved our bot classification and now distinguish four categories instead of three:
That is, the category of “browser bots” that we were using previously, has been split into two distinct types: “puppeteer bots” and “smart bots.”
In Q2 2025, the distribution of bad bots by type was as follows: as usual, simple bots made up the majority (59.2%). They were followed by API bots (38%), while puppeteer bots and smart bots accounted for just 2.58% and 0.23% of traffic, respectively.
Let’s return to the longest bot attack of the quarter, which we already mentioned earlier — it was also the largest in scale. In early April, we started protecting a high-traffic resource from the “E-commerce” industry segment.
However, the attackers did not immediately notice that their requests were no longer having the intended effect and continued their activity for just over a month after our protection was activated. During this time, the attackers sent — and we blocked — 1,934,485,130 requests, roughly equivalent to our average monthly volume of bad bot traffic.
The fastest bot attack of the quarter also targeted the “E-commerce” segment. The peak request rate of this attack reached 441,147 requests per second.
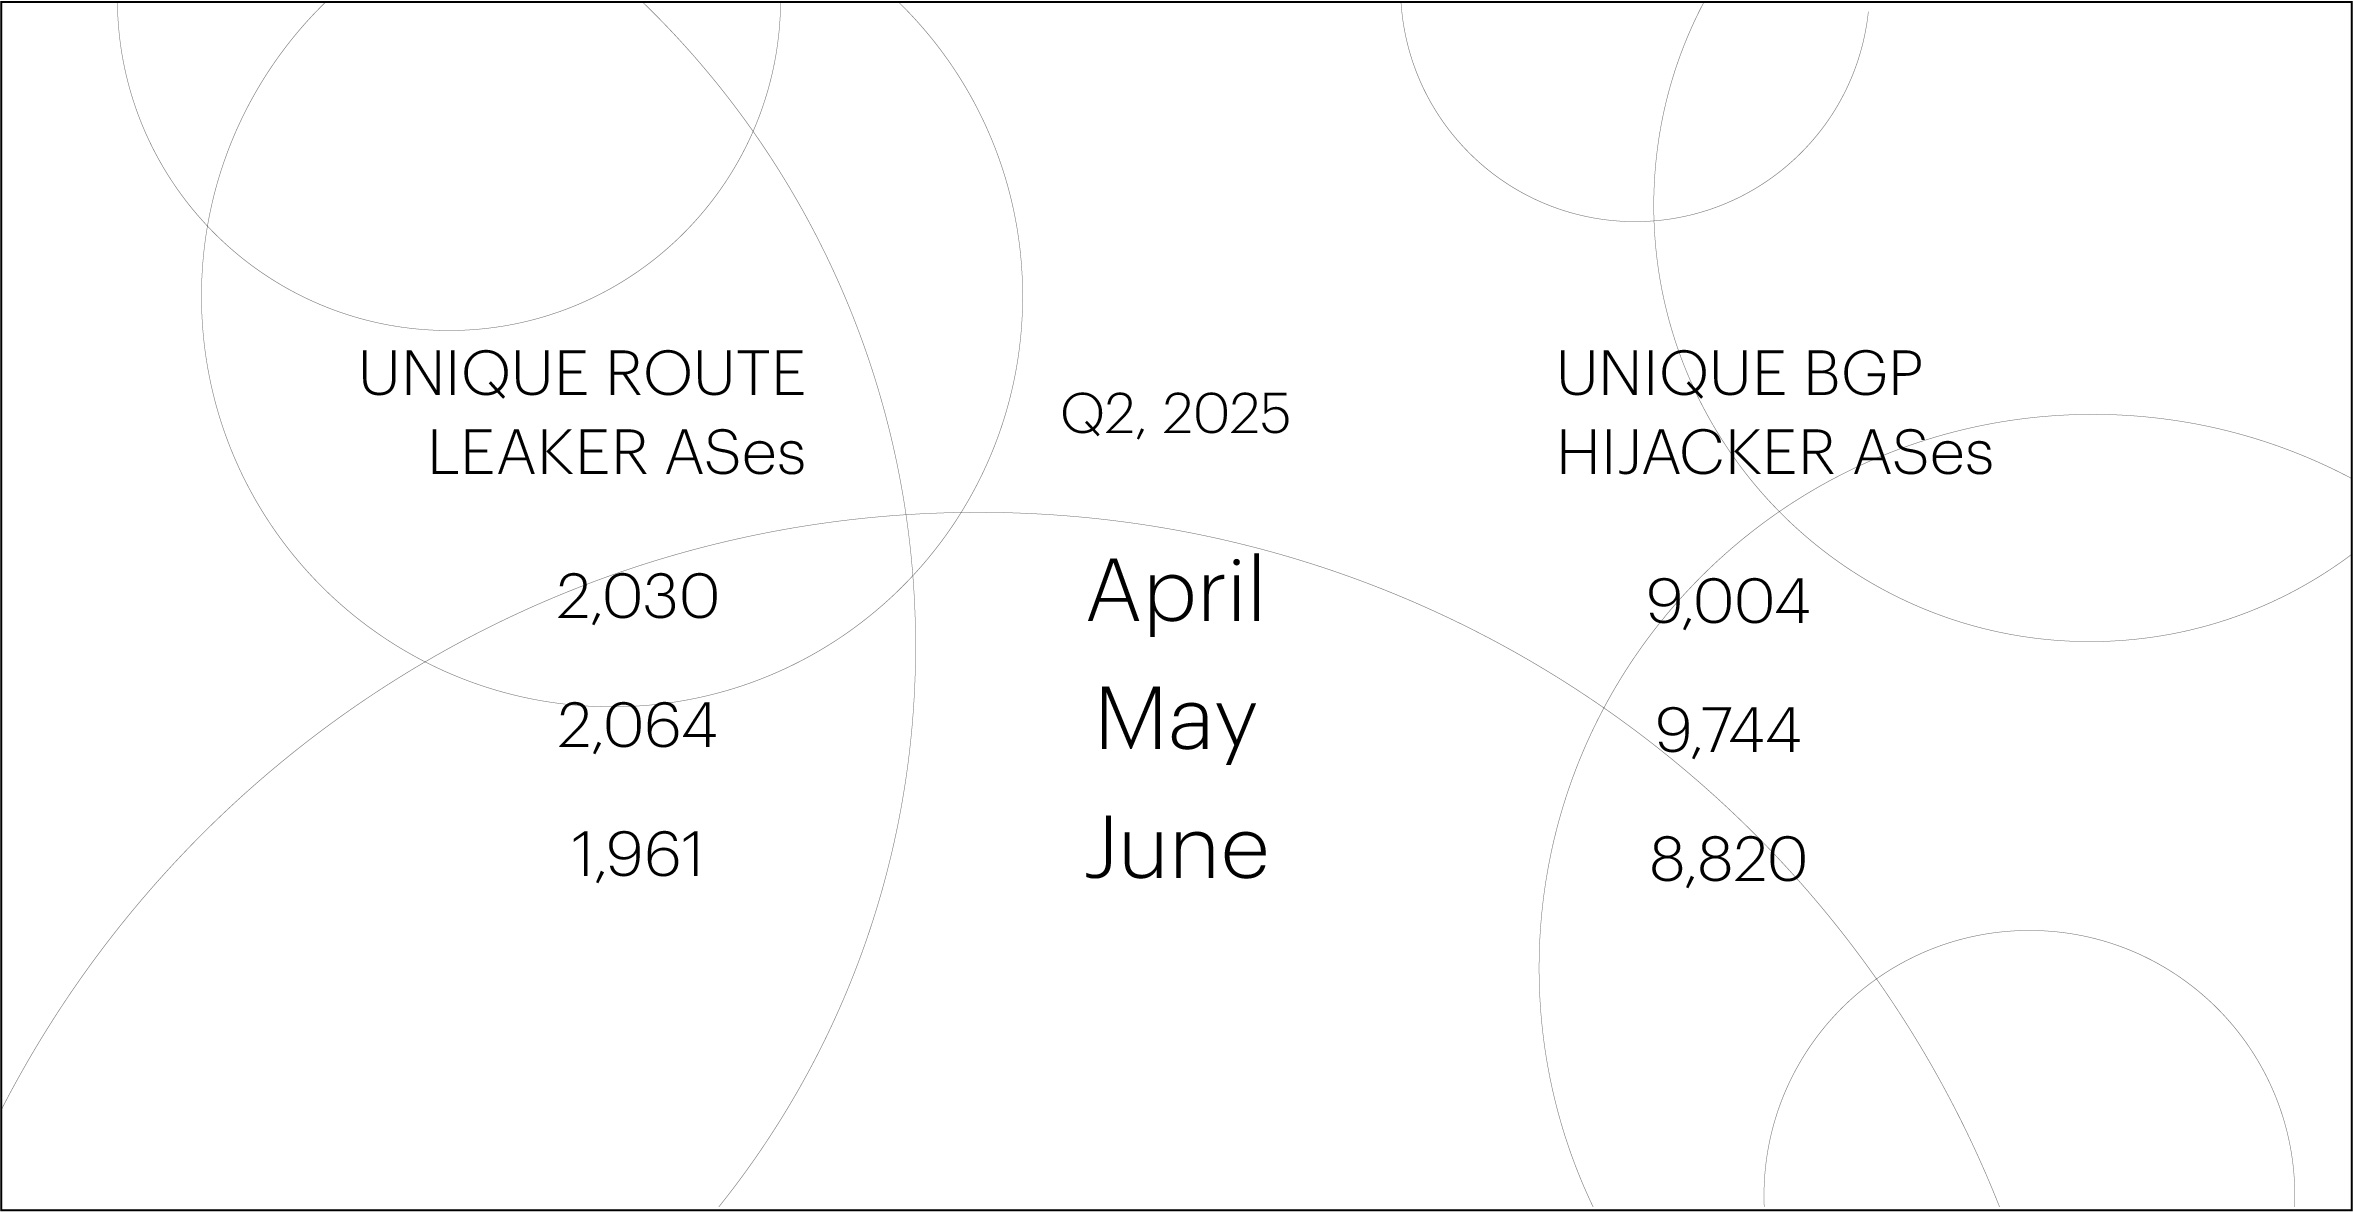
The number of unique autonomous systems (ASes) responsible for route leaks and BGP hijacks in Q2 2025 remained relatively stable, showing no significant change compared to the previous several quarters. This indicates that the underlying risks associated with BGP misconfigurations and malicious activity continue to persist.
Note: The Qrator.Radar team identifies global BGP incidents using a set of threshold criteria. These include the number of affected prefixes and autonomous systems, as well as the extent of the anomaly’s propagation across routing tables.
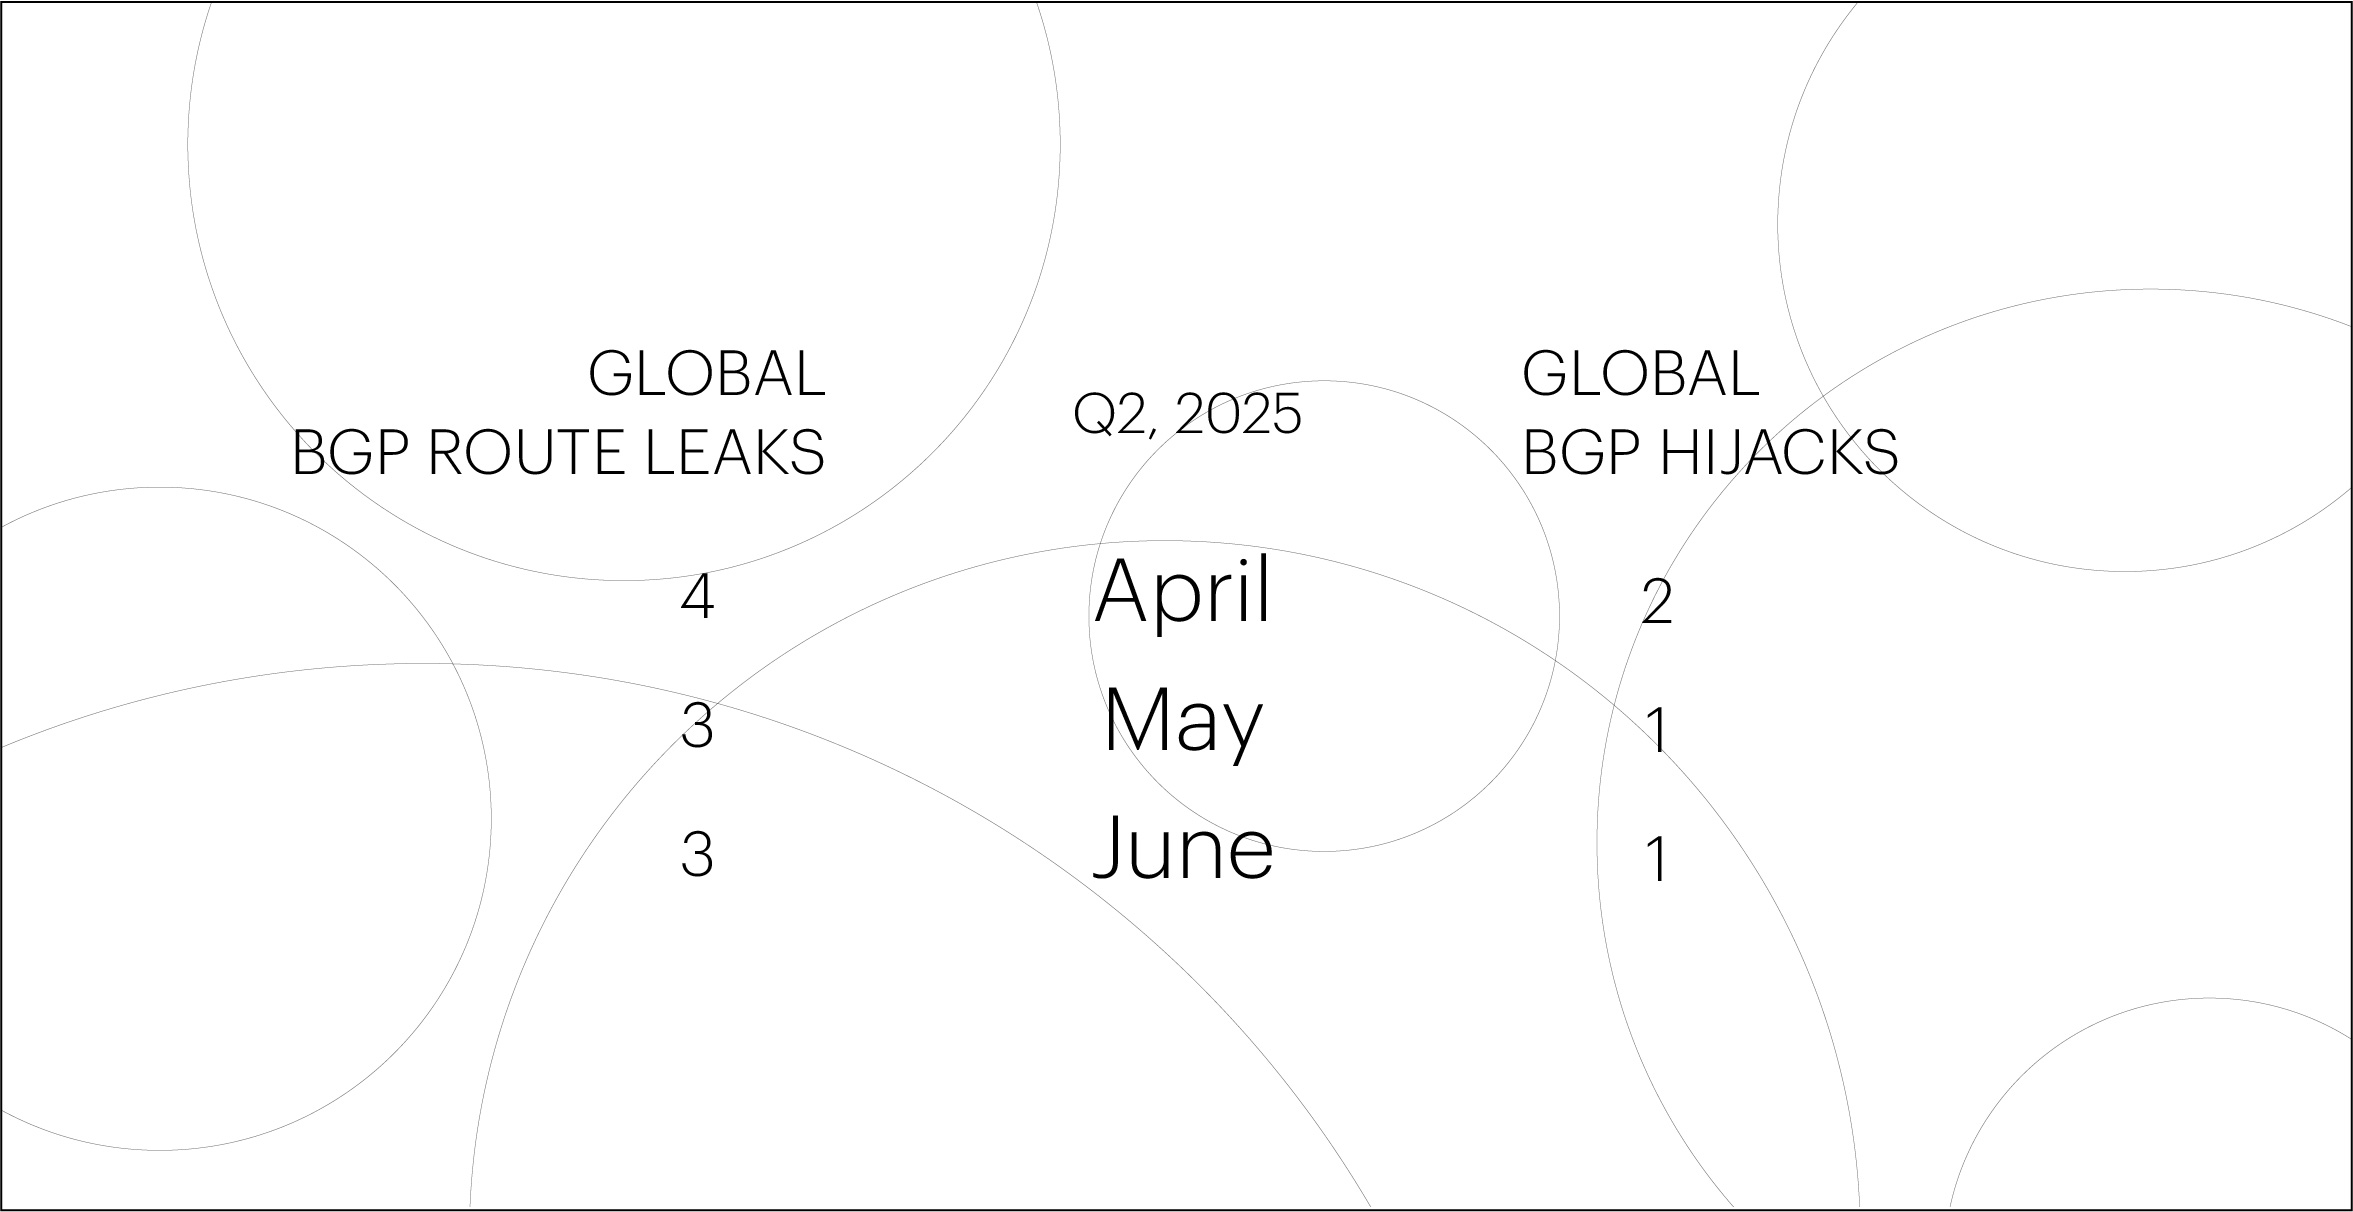
The number of global BGP incidents in Q2 2025 increased significantly compared to the previous reporting period, which saw an unexpected period of calm. In fact, Q2 2025 set a new record for the past two years in terms of global incidents: in total, we recorded 14 such events — 10 global route leaks and 4 global BGP hijacks.
The global route leaks observed in Q2 affected various providers across multiple regions. We expect such incidents to continue in the near future, as protective mechanisms like RFC 9234 and ASPA are still far from widespread adoption.
Share your experience and expectations regarding DDoS protection. Your answers will help us tailor solutions to meet your cybersecurity needs.
Tell us about your company’s infrastructure and critical systems. This will help us understand the scope of protection you require.
Help us learn about how decisions are made in your company. This information will guide us in offering the most relevant solutions.
Let us know what drives your choices when it comes to DDoS protection. Your input will help us focus on what matters most to you.
