The number of L3-L4 DDoS attacks exceeding 1 Gbps is growing at an accelerating pace: in Q1 2025, we recorded a 110% increase compared to the same period in 2024. As a reminder, since the beginning of last year, we have been excluding incidents below 1 Gbps from our statistics, considering them noise.
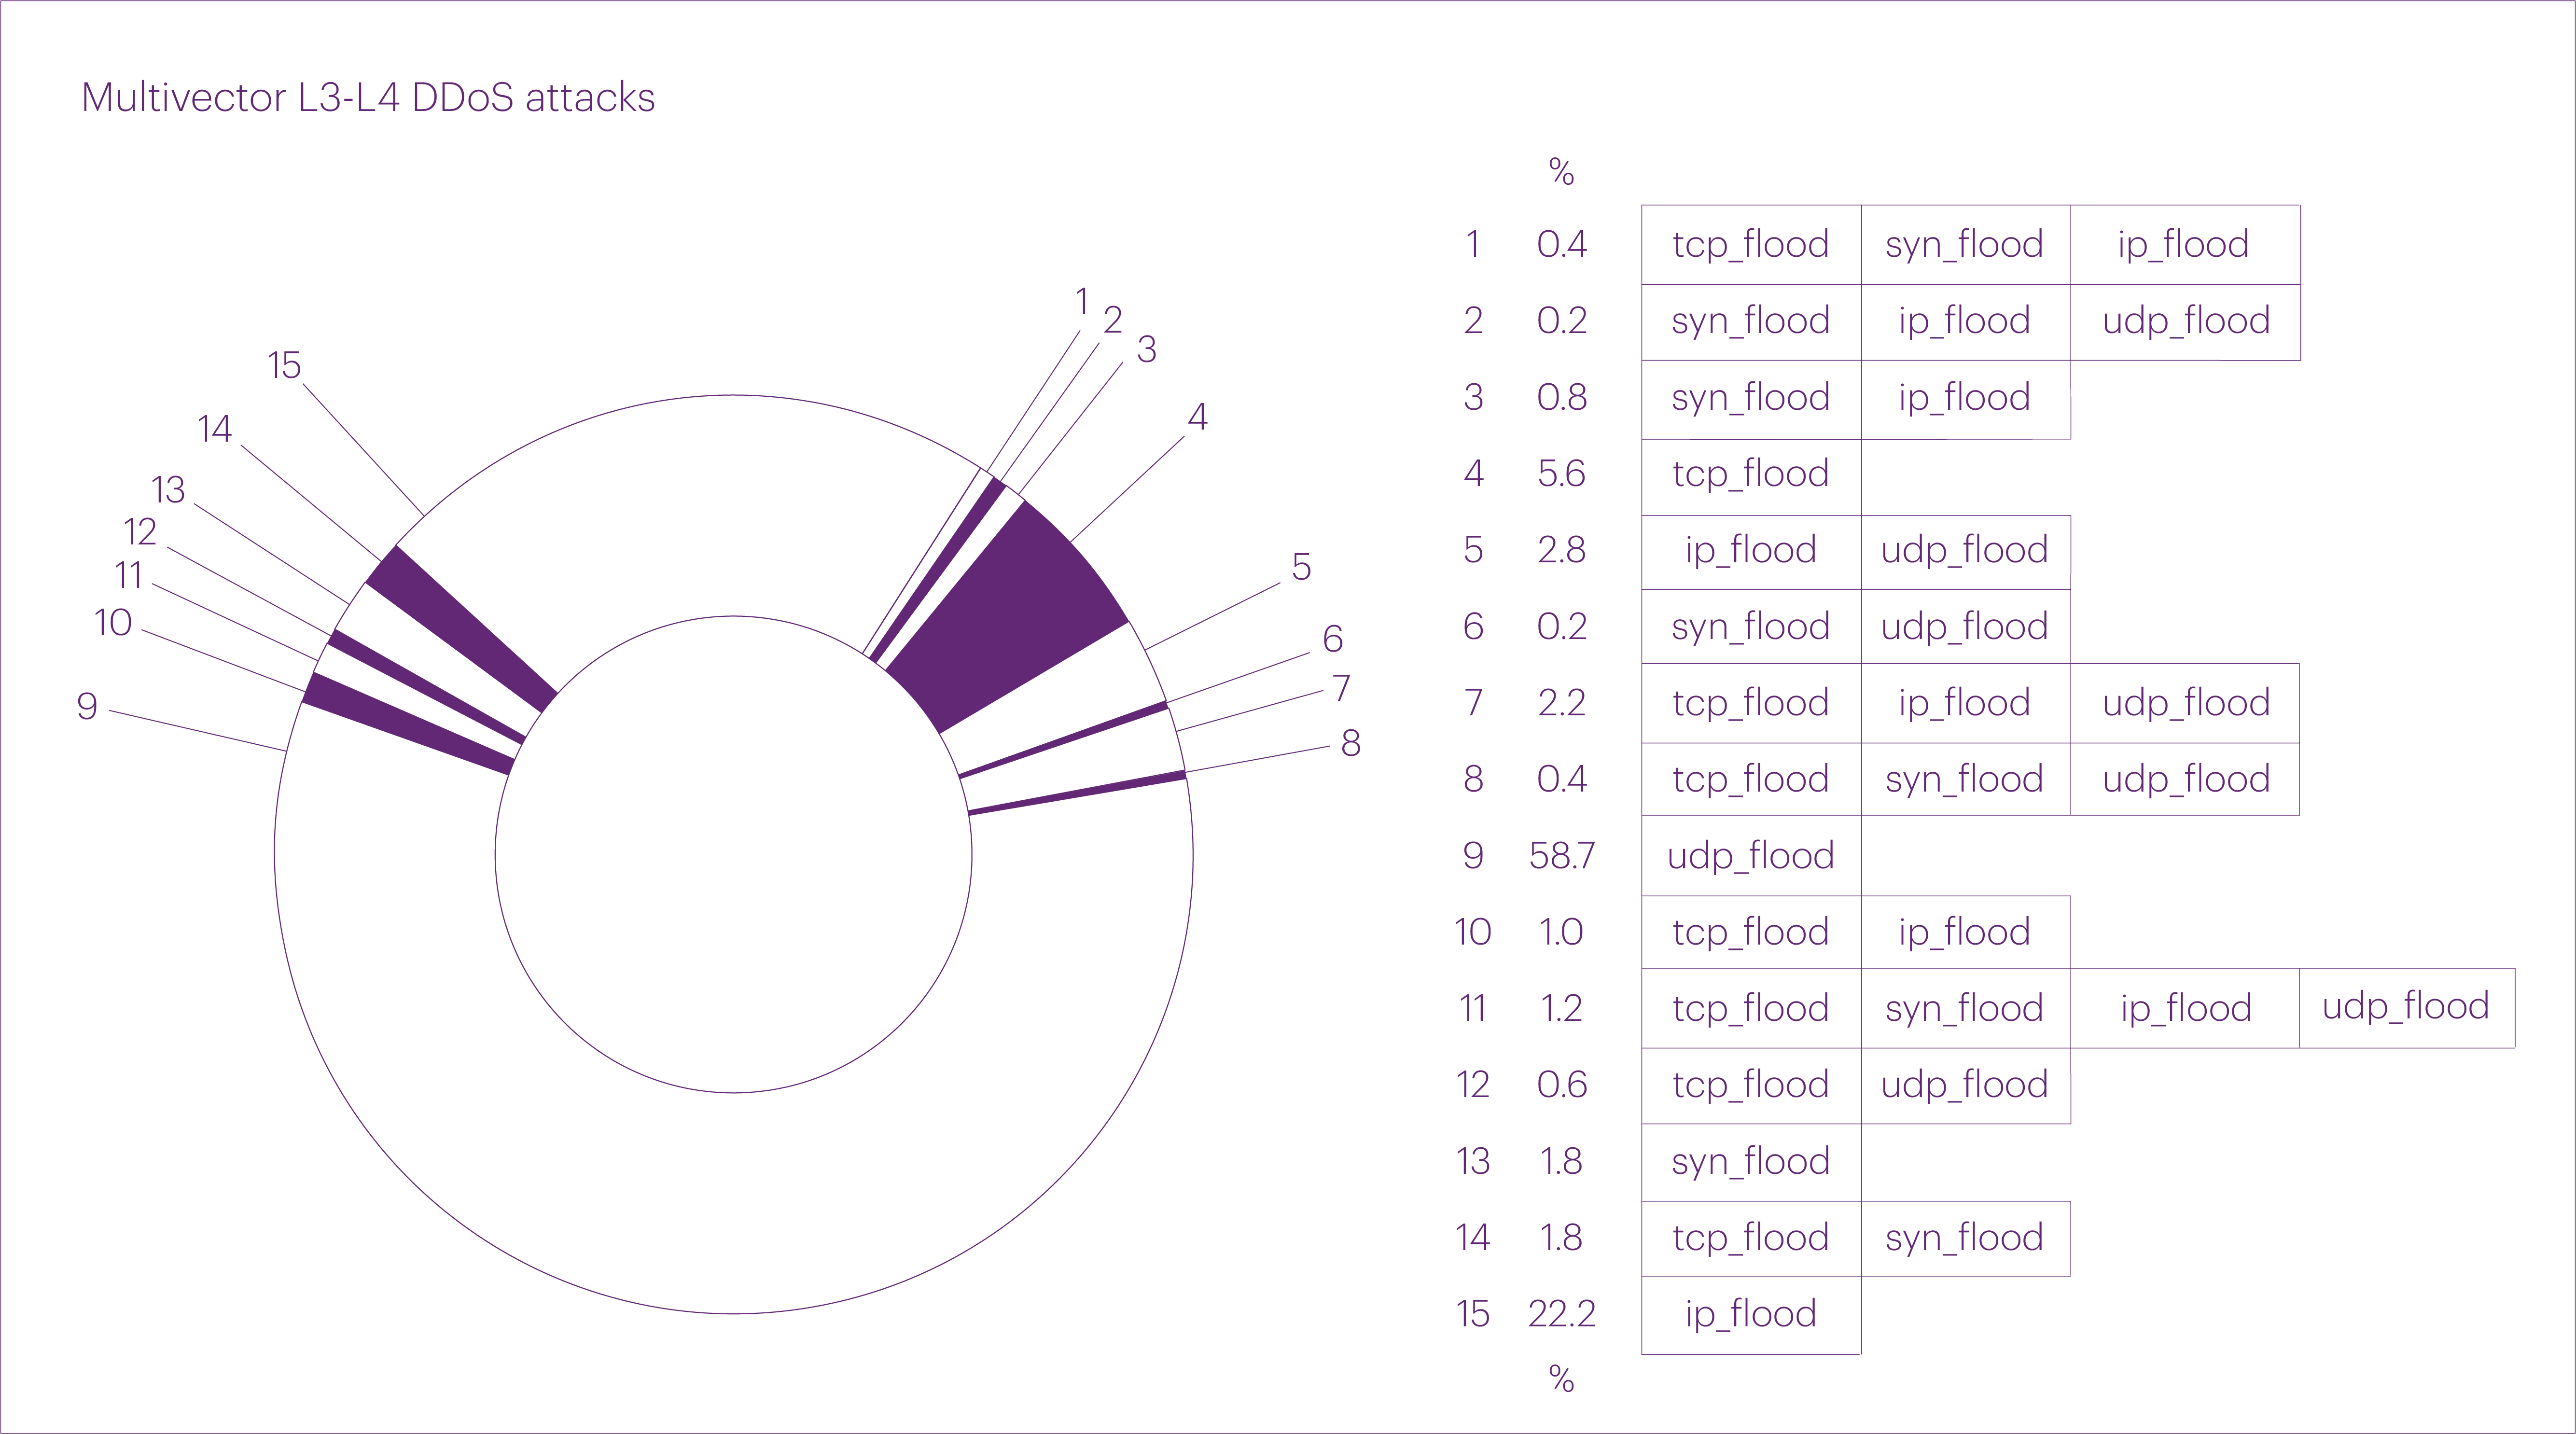
The absolute number of multivector attacks in Q1 2025 also grew significantly compared to the same period last year (+20.8%). However, this increase lagged behind the overall increase in L3-L4 attacks. As a result, the share of multivector attacks dropped almost by half — from 22.8% to 11.7%.
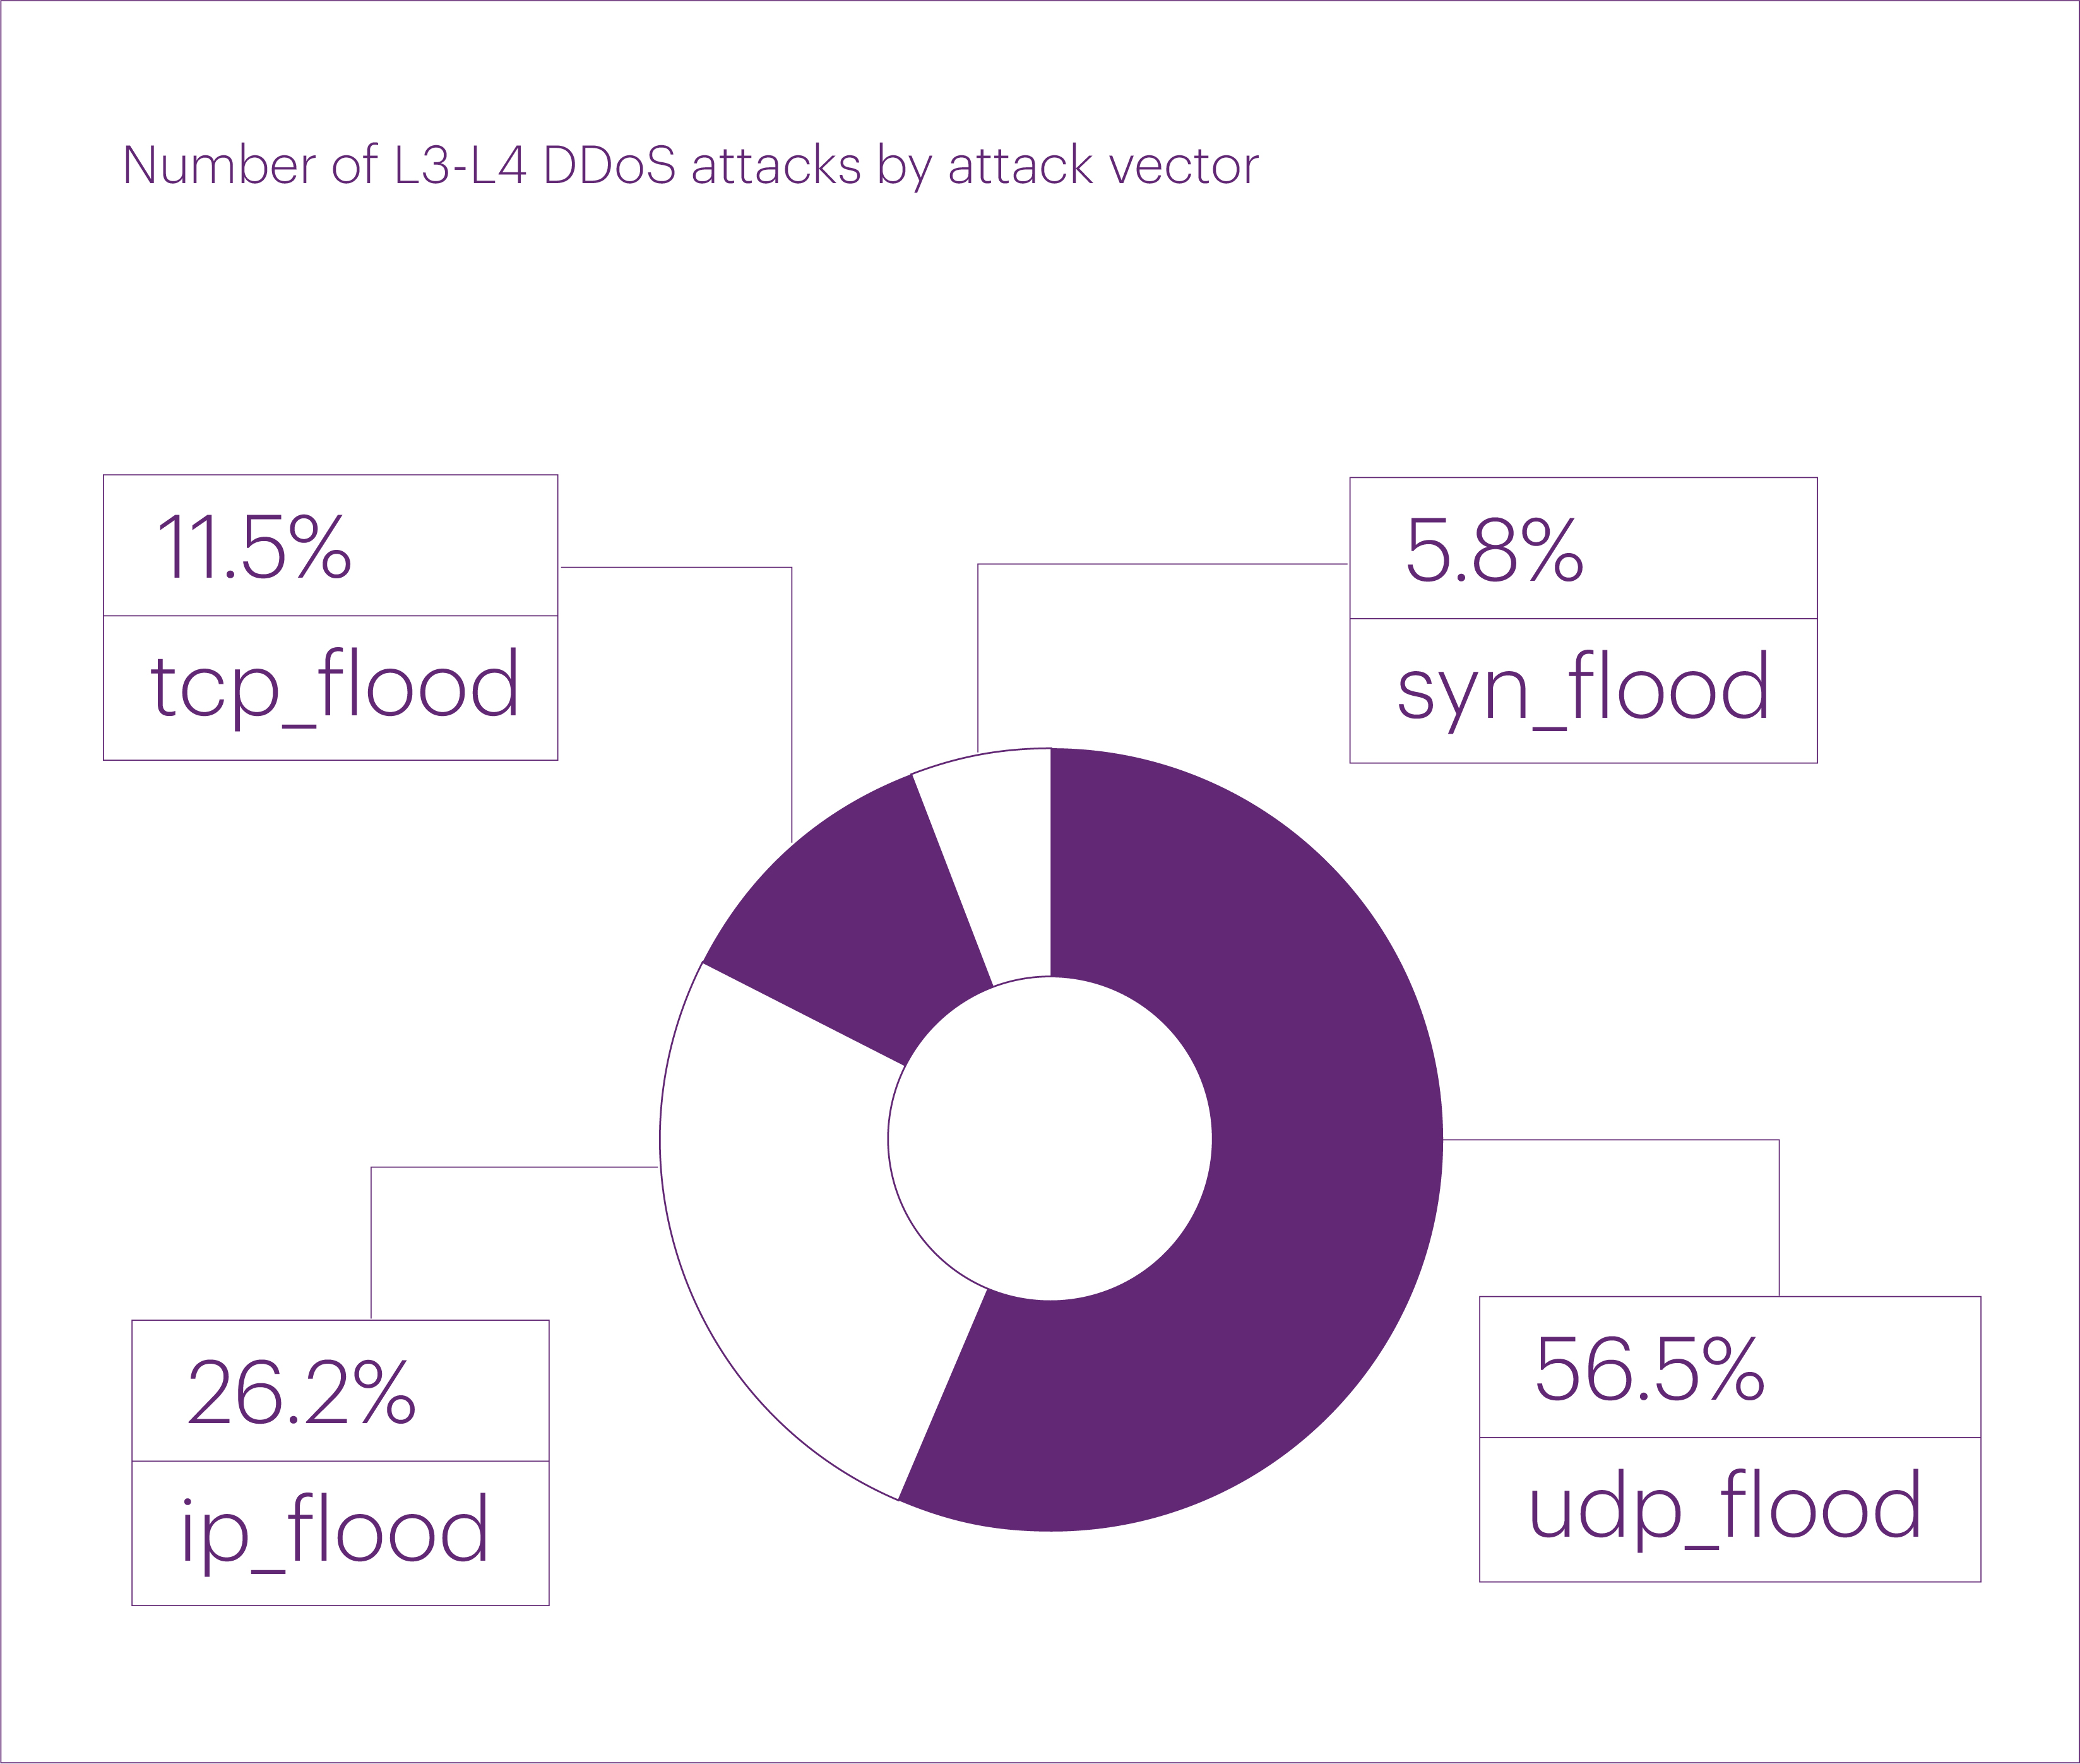
Excluding mixed-vector attacks, the distribution of “pure” attack vectors in Q1 2025 was as follows: UDP flood remained the most common, accounting for over half of all L3-L4 DDoS attacks (56.5%). It was followed by IP fragmentation flood (26.2%), TCP flood (11.5%), and SYN flood (5.8%). Interestingly, we didn’t record a single ICMP flood attack throughout the entire first quarter.
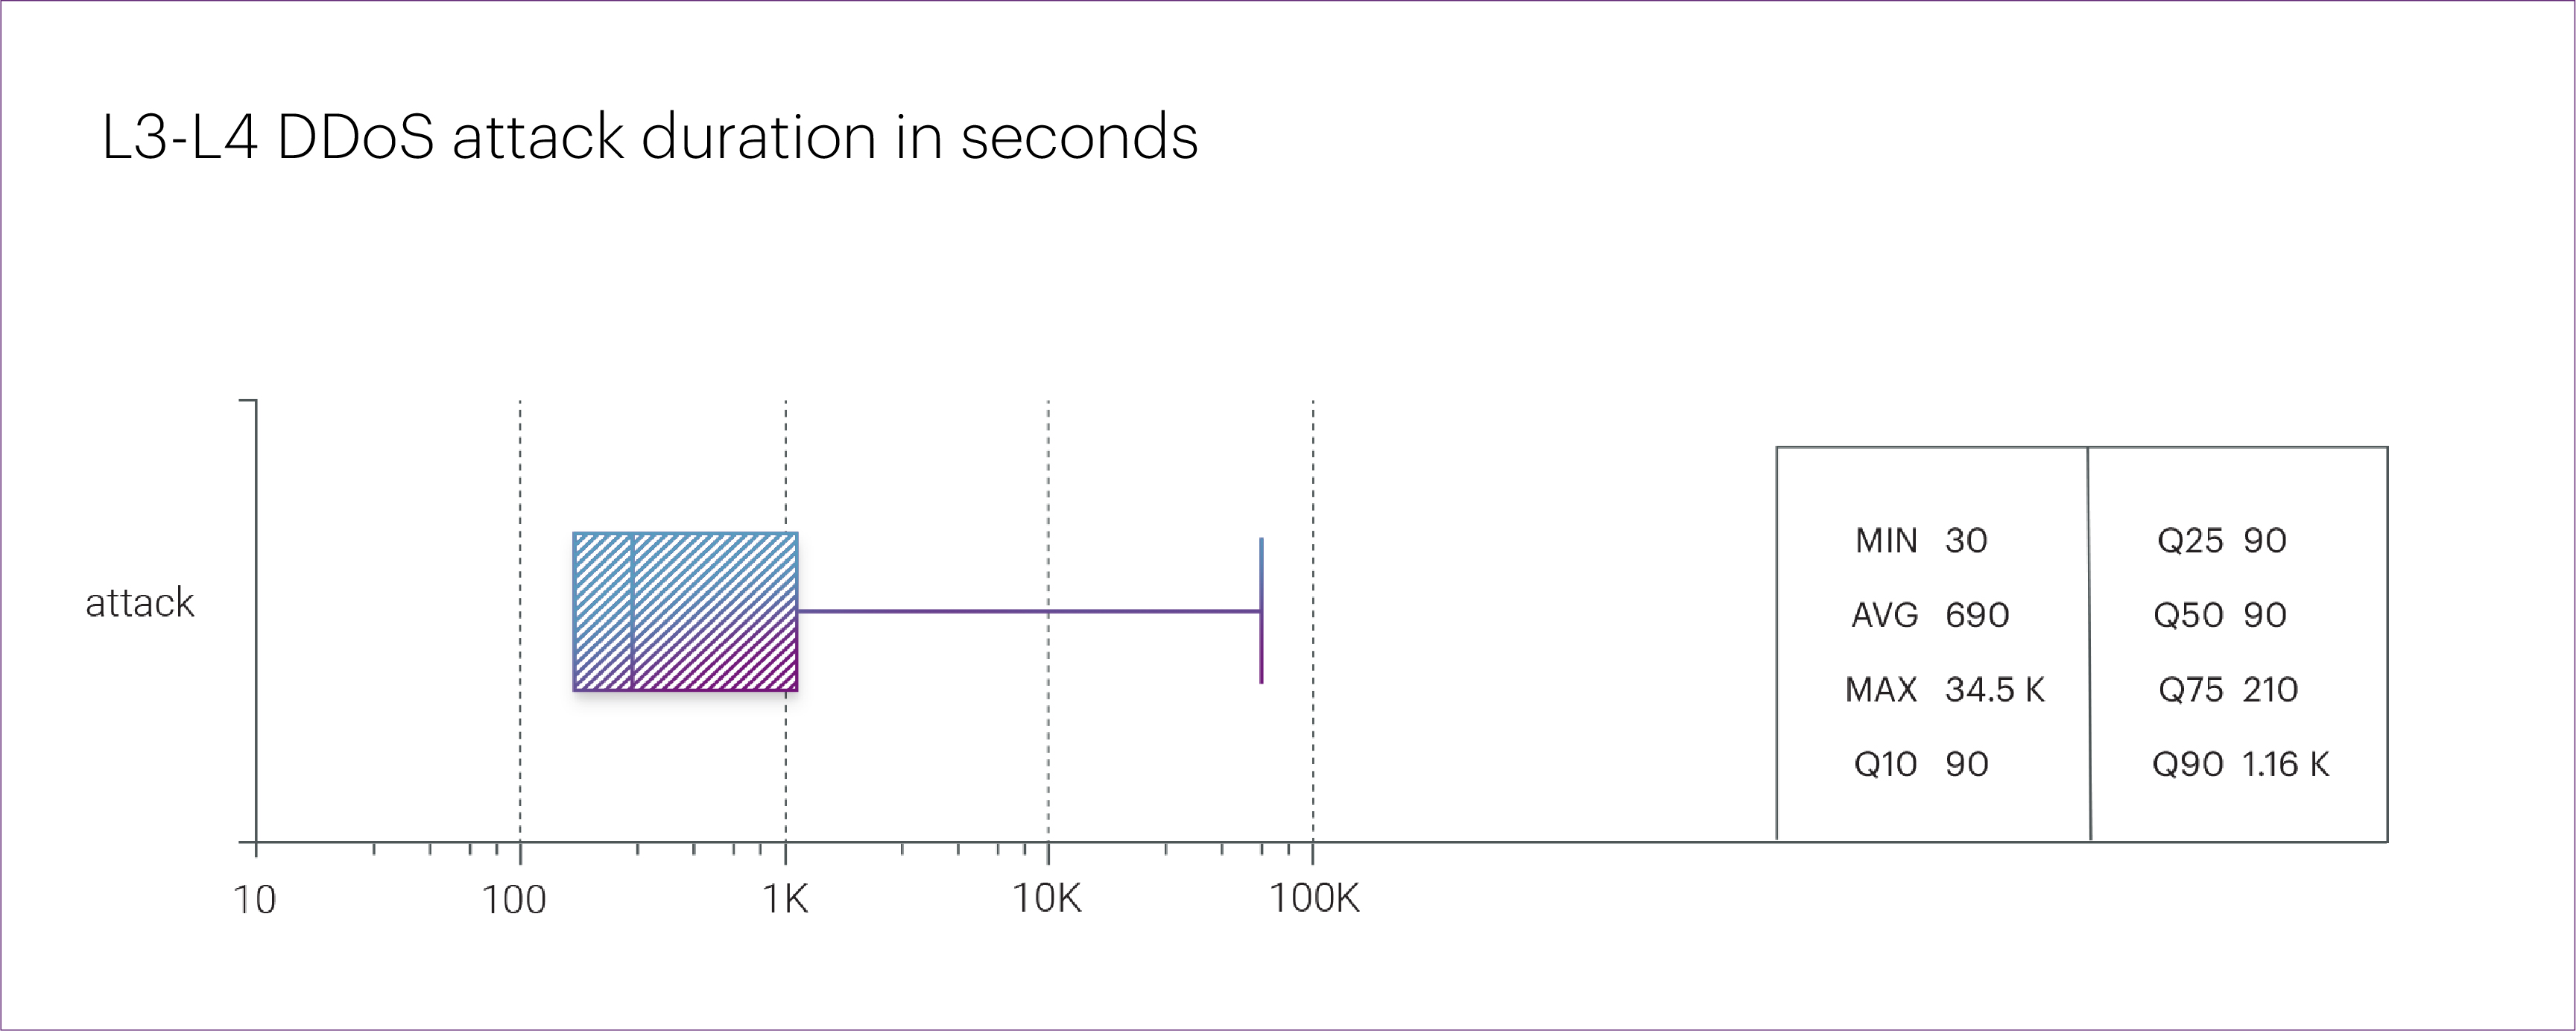
In terms of duration, DDoS attacks in the first quarter of 2025 were relatively modest. The longest incident lasted just 9.6 hours — a UDP flood targeting an organization in the “Industrial” segment, specifically the “Oil&Gas” microsegment.
The average duration of attacks dropped from 71.7 minutes last year to just 11.5 minutes this quarter. The median fell as well — from 150 seconds to 90 seconds.
This trend currently runs counter to the hypothesis we outlined in the 2024 annual report, where we linked longer attack durations to the growing use of massive botnets made up of vulnerable devices in developing countries.
While these botnets are indeed getting larger (we’ll return to this topic later), the attacks themselves remain relatively short. Still, it’s too early to draw firm conclusions — the year has only just begun.
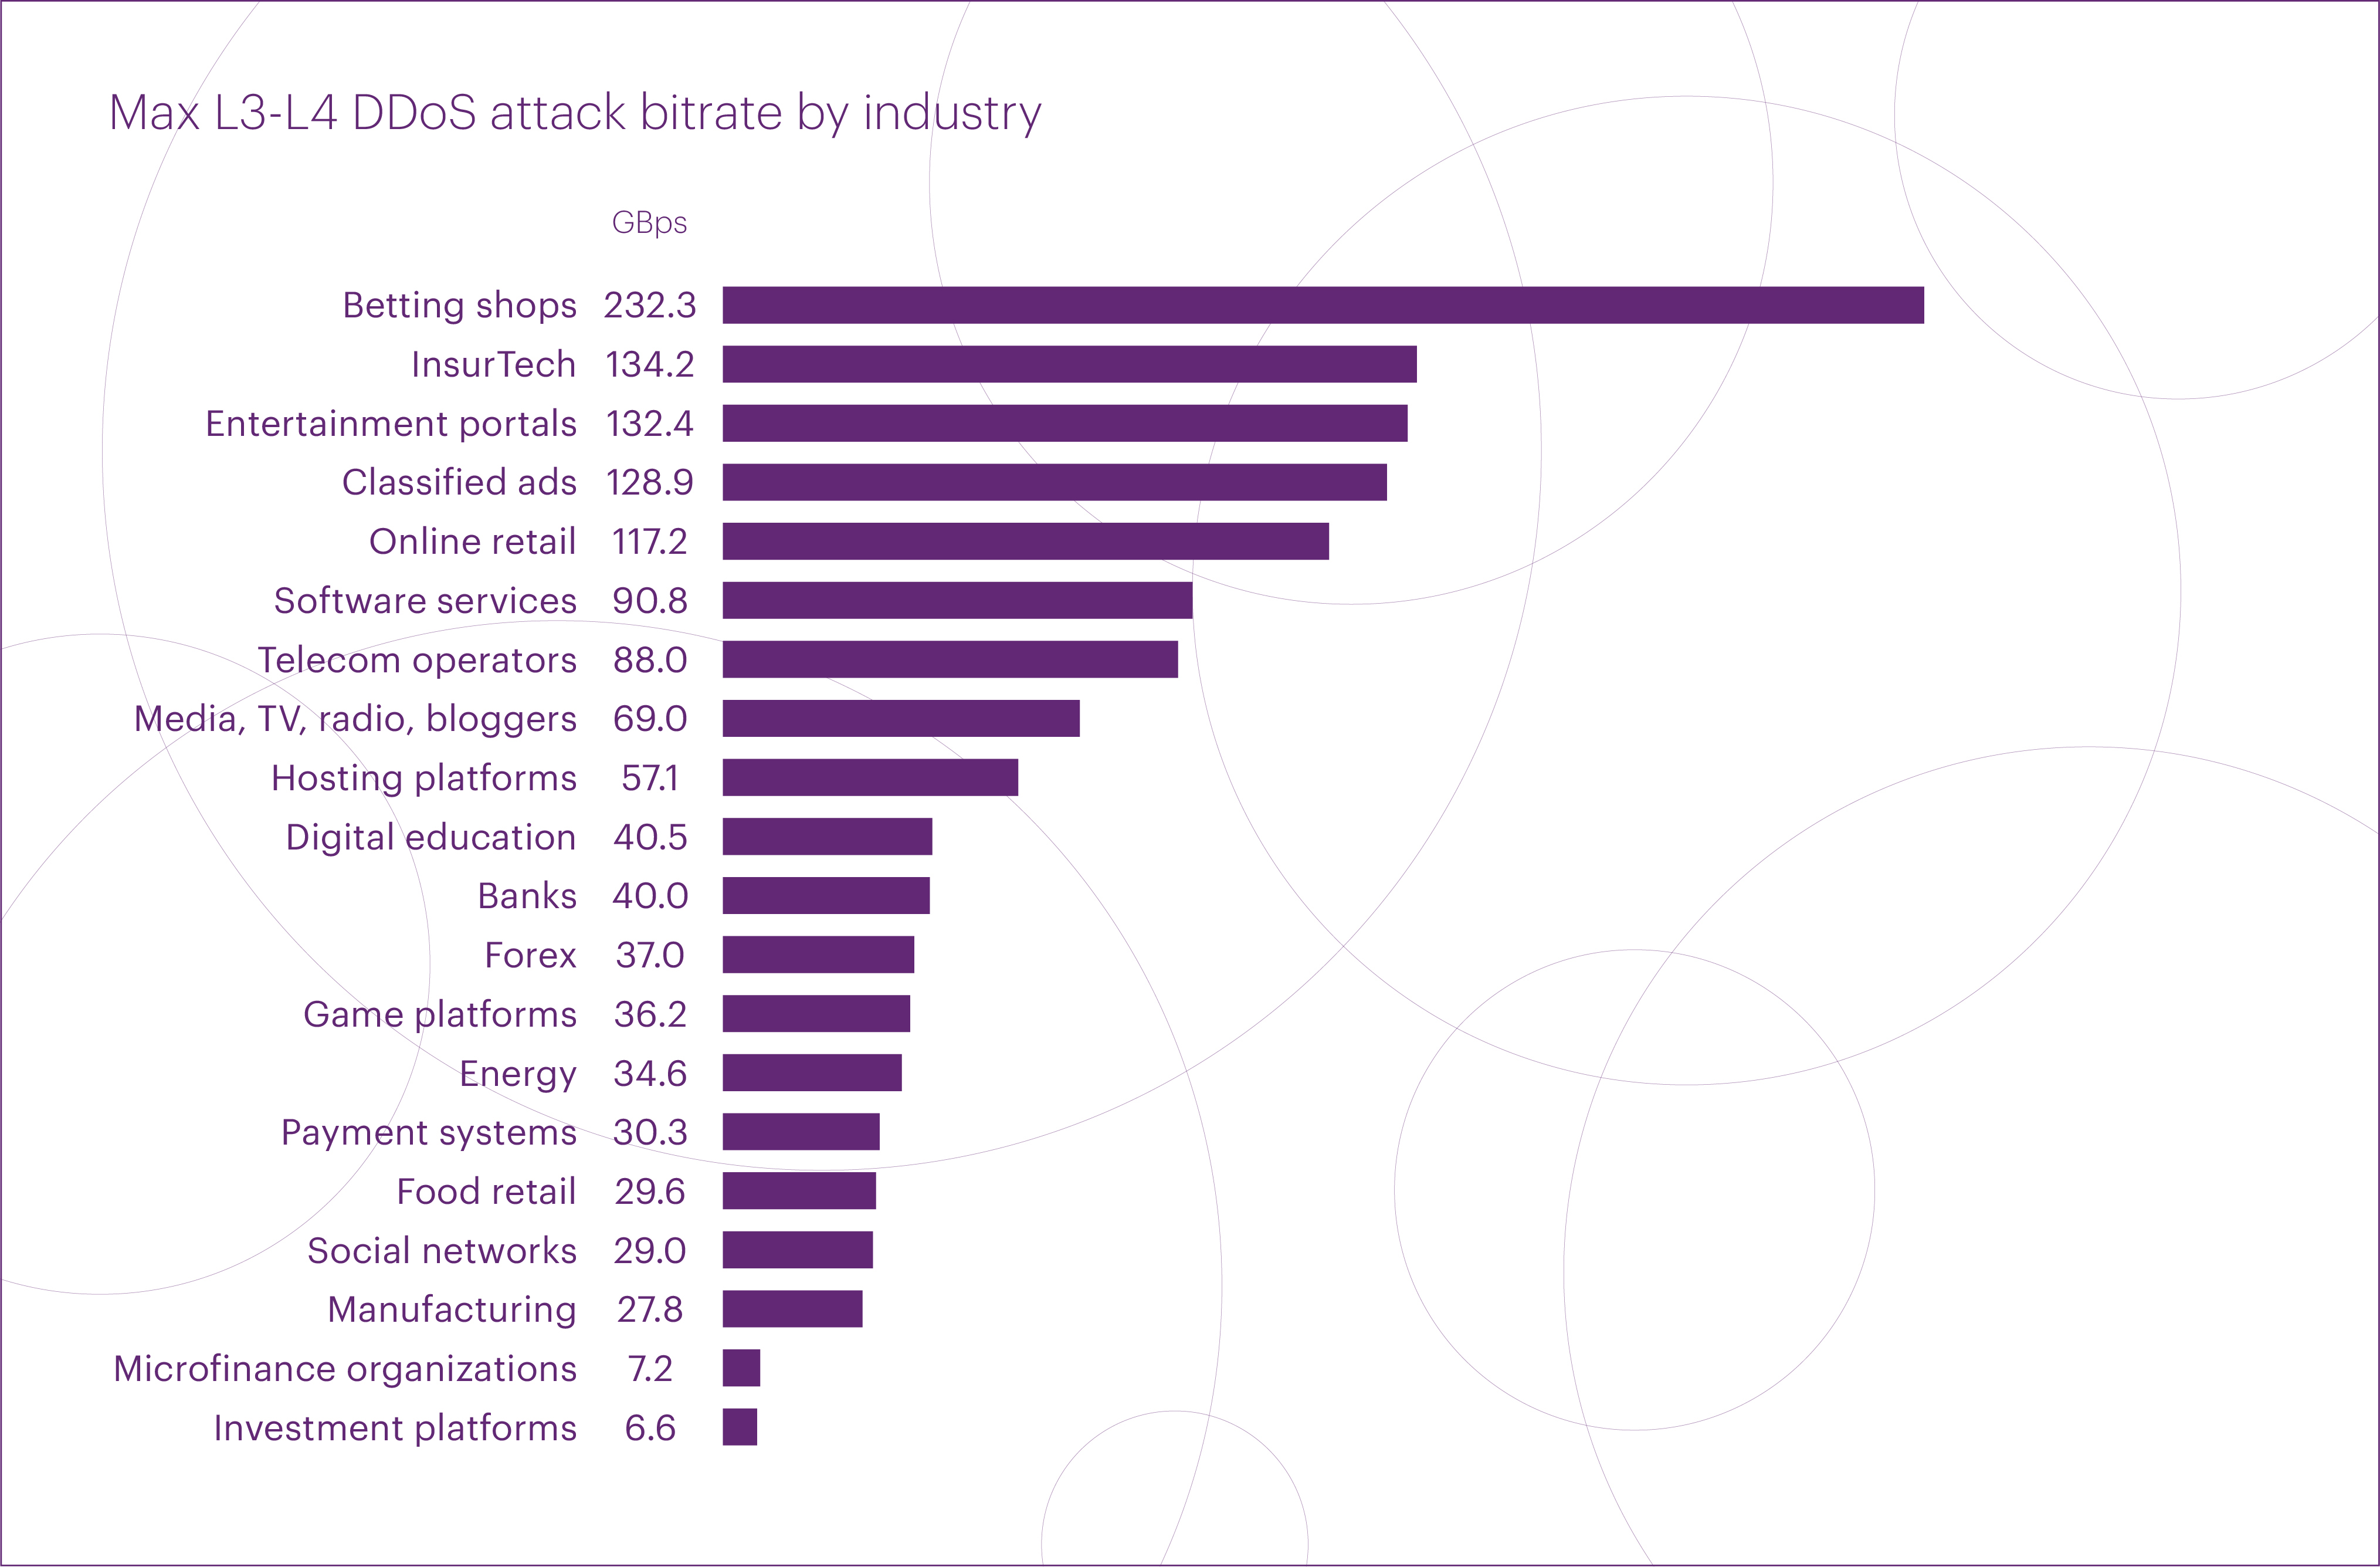
The most intense attack in Q1 2025 peaked at 232 Gbps. It was a UDP flood targeting the “Betting shops” segment. Compared to last year’s records, this figure is notably lower. For reference, the most powerful attack in Q1 2024 reached 882 Gbps, while the highest-intensity attack of the entire year peaked at 1,140 Gbps.
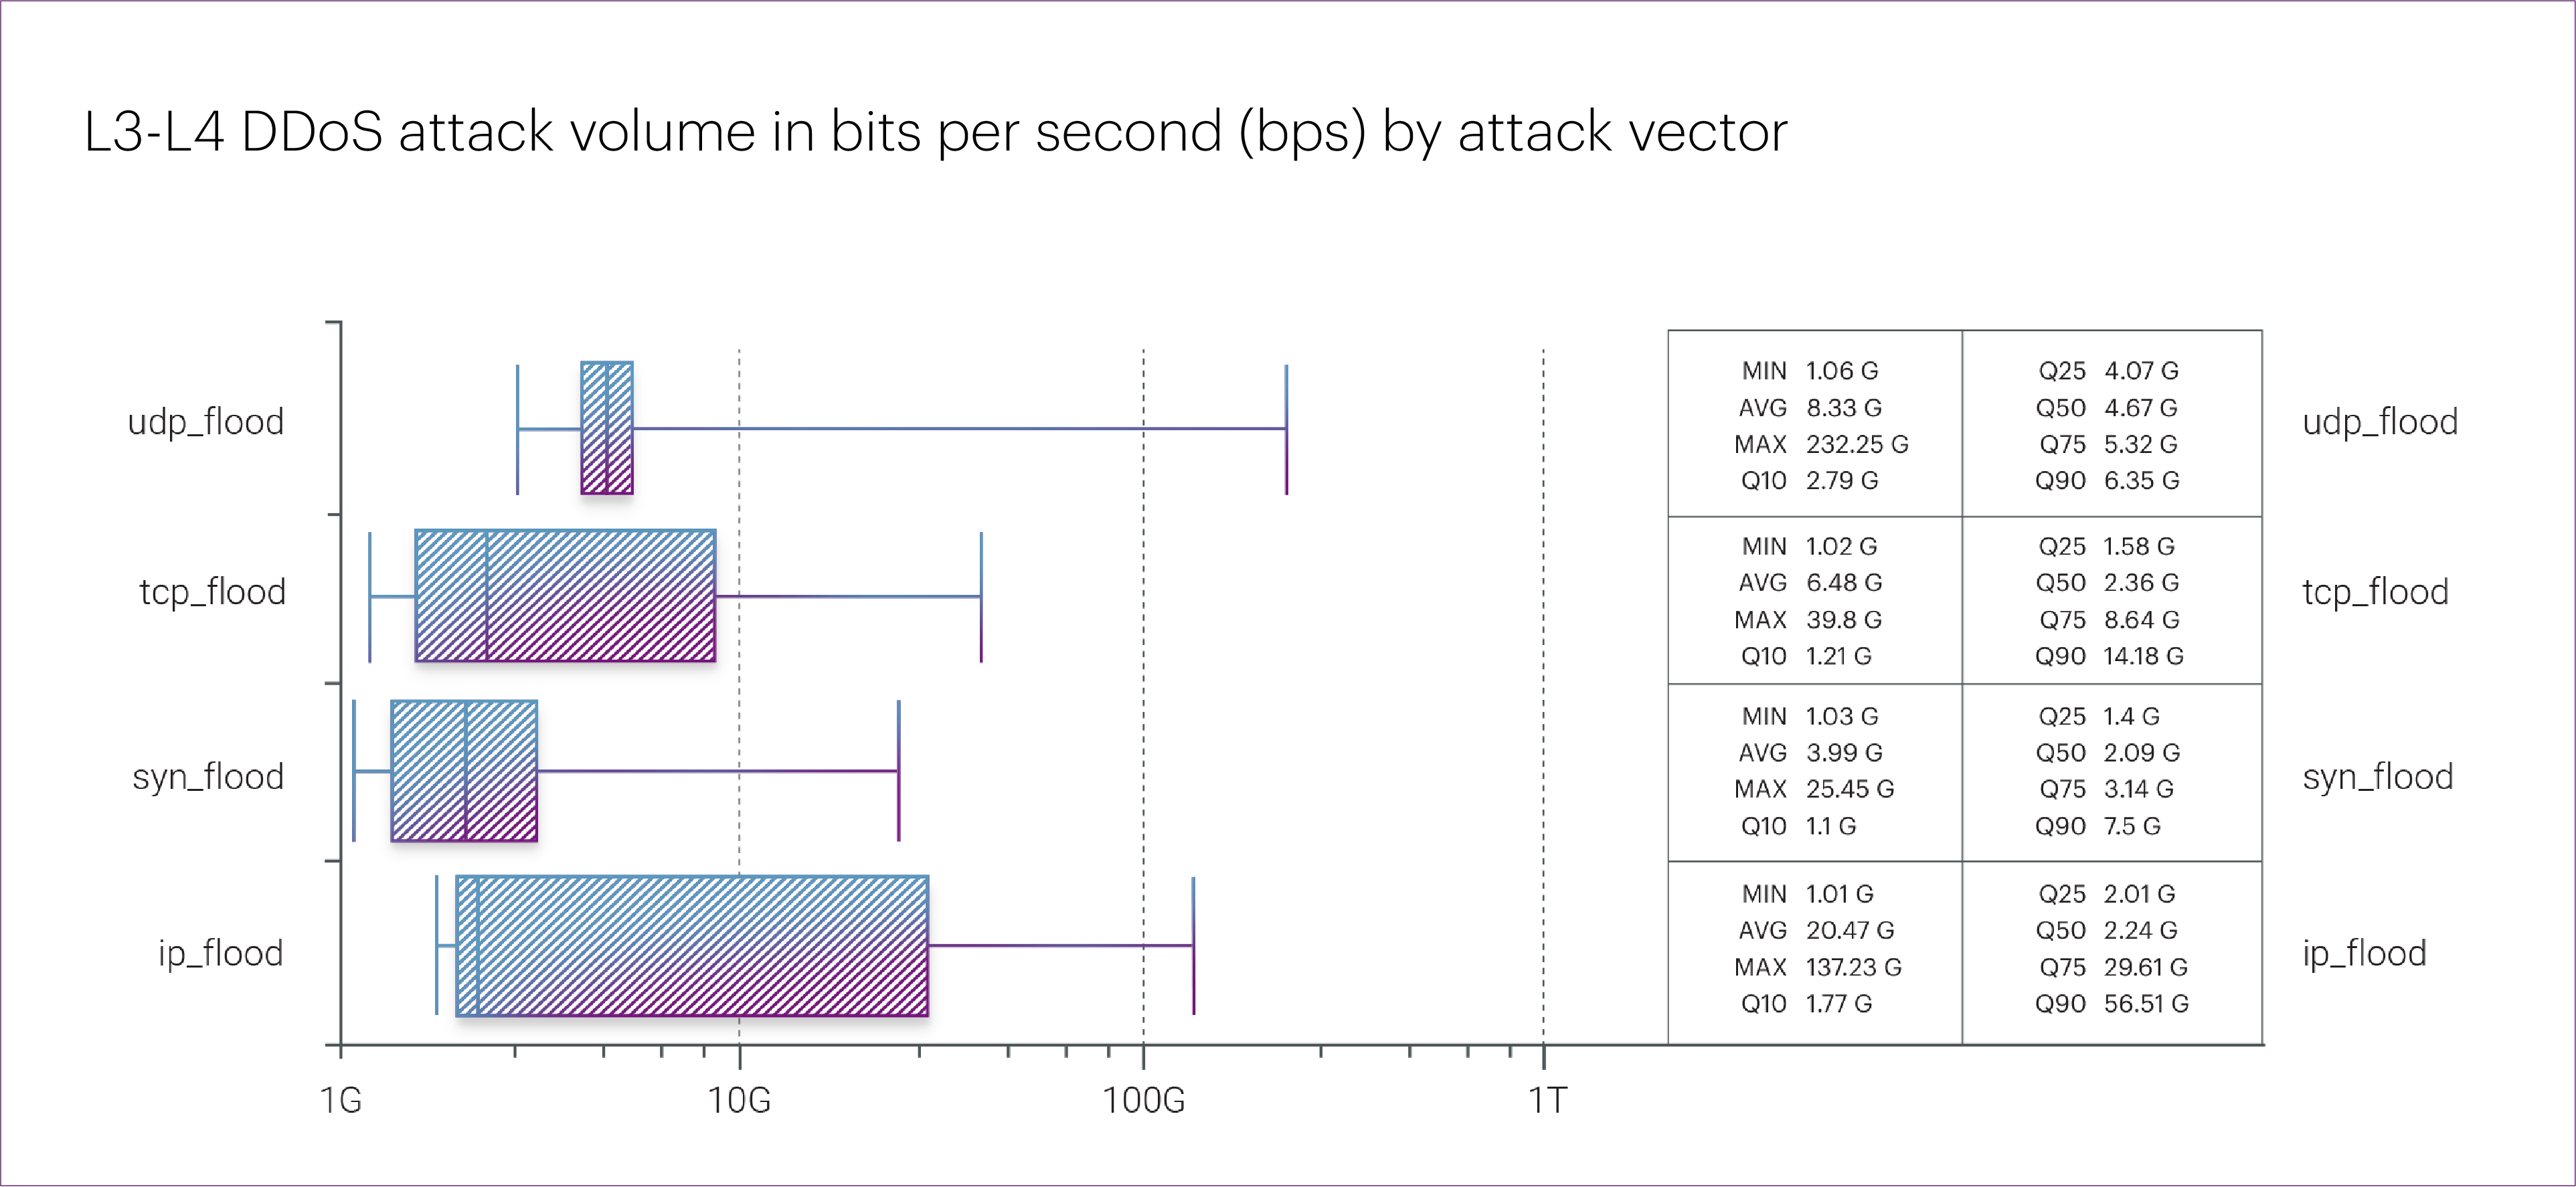
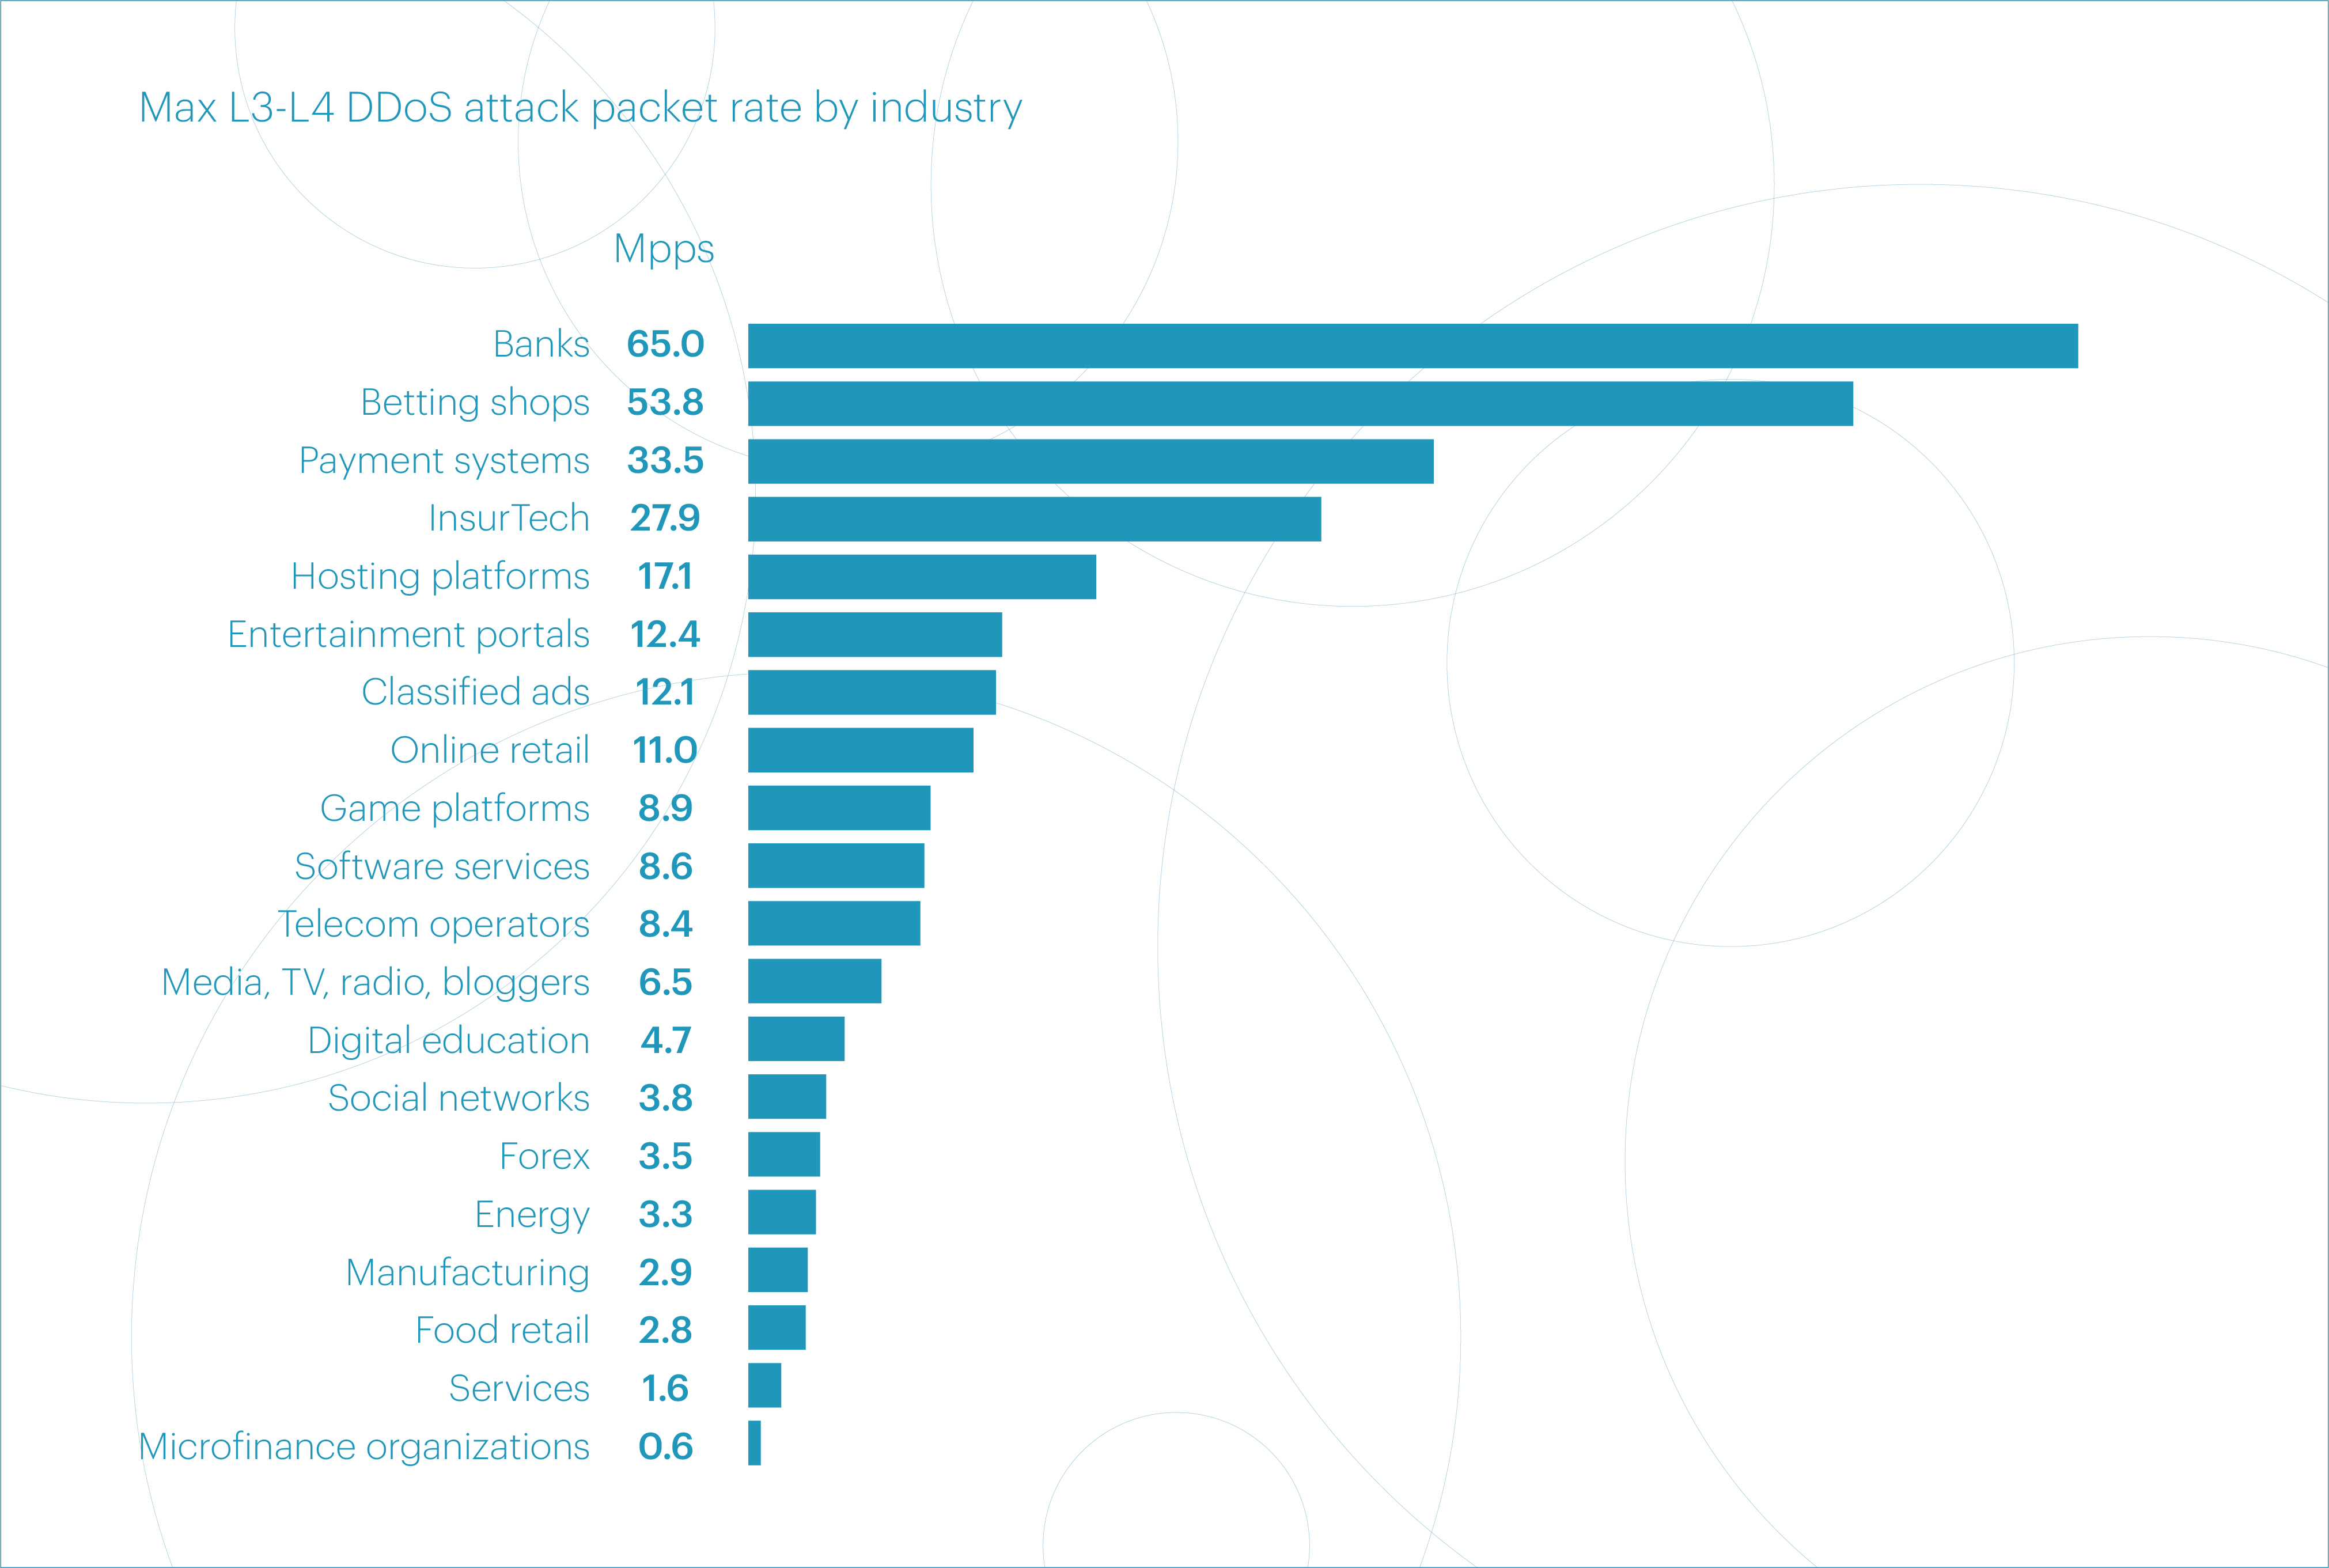
The same goes for packet rate: the Q1 2025 peak of 65 Mpps looks unimpressive compared to the 2024 record of 179 Mpps — which, incidentally, was also set in the first quarter.
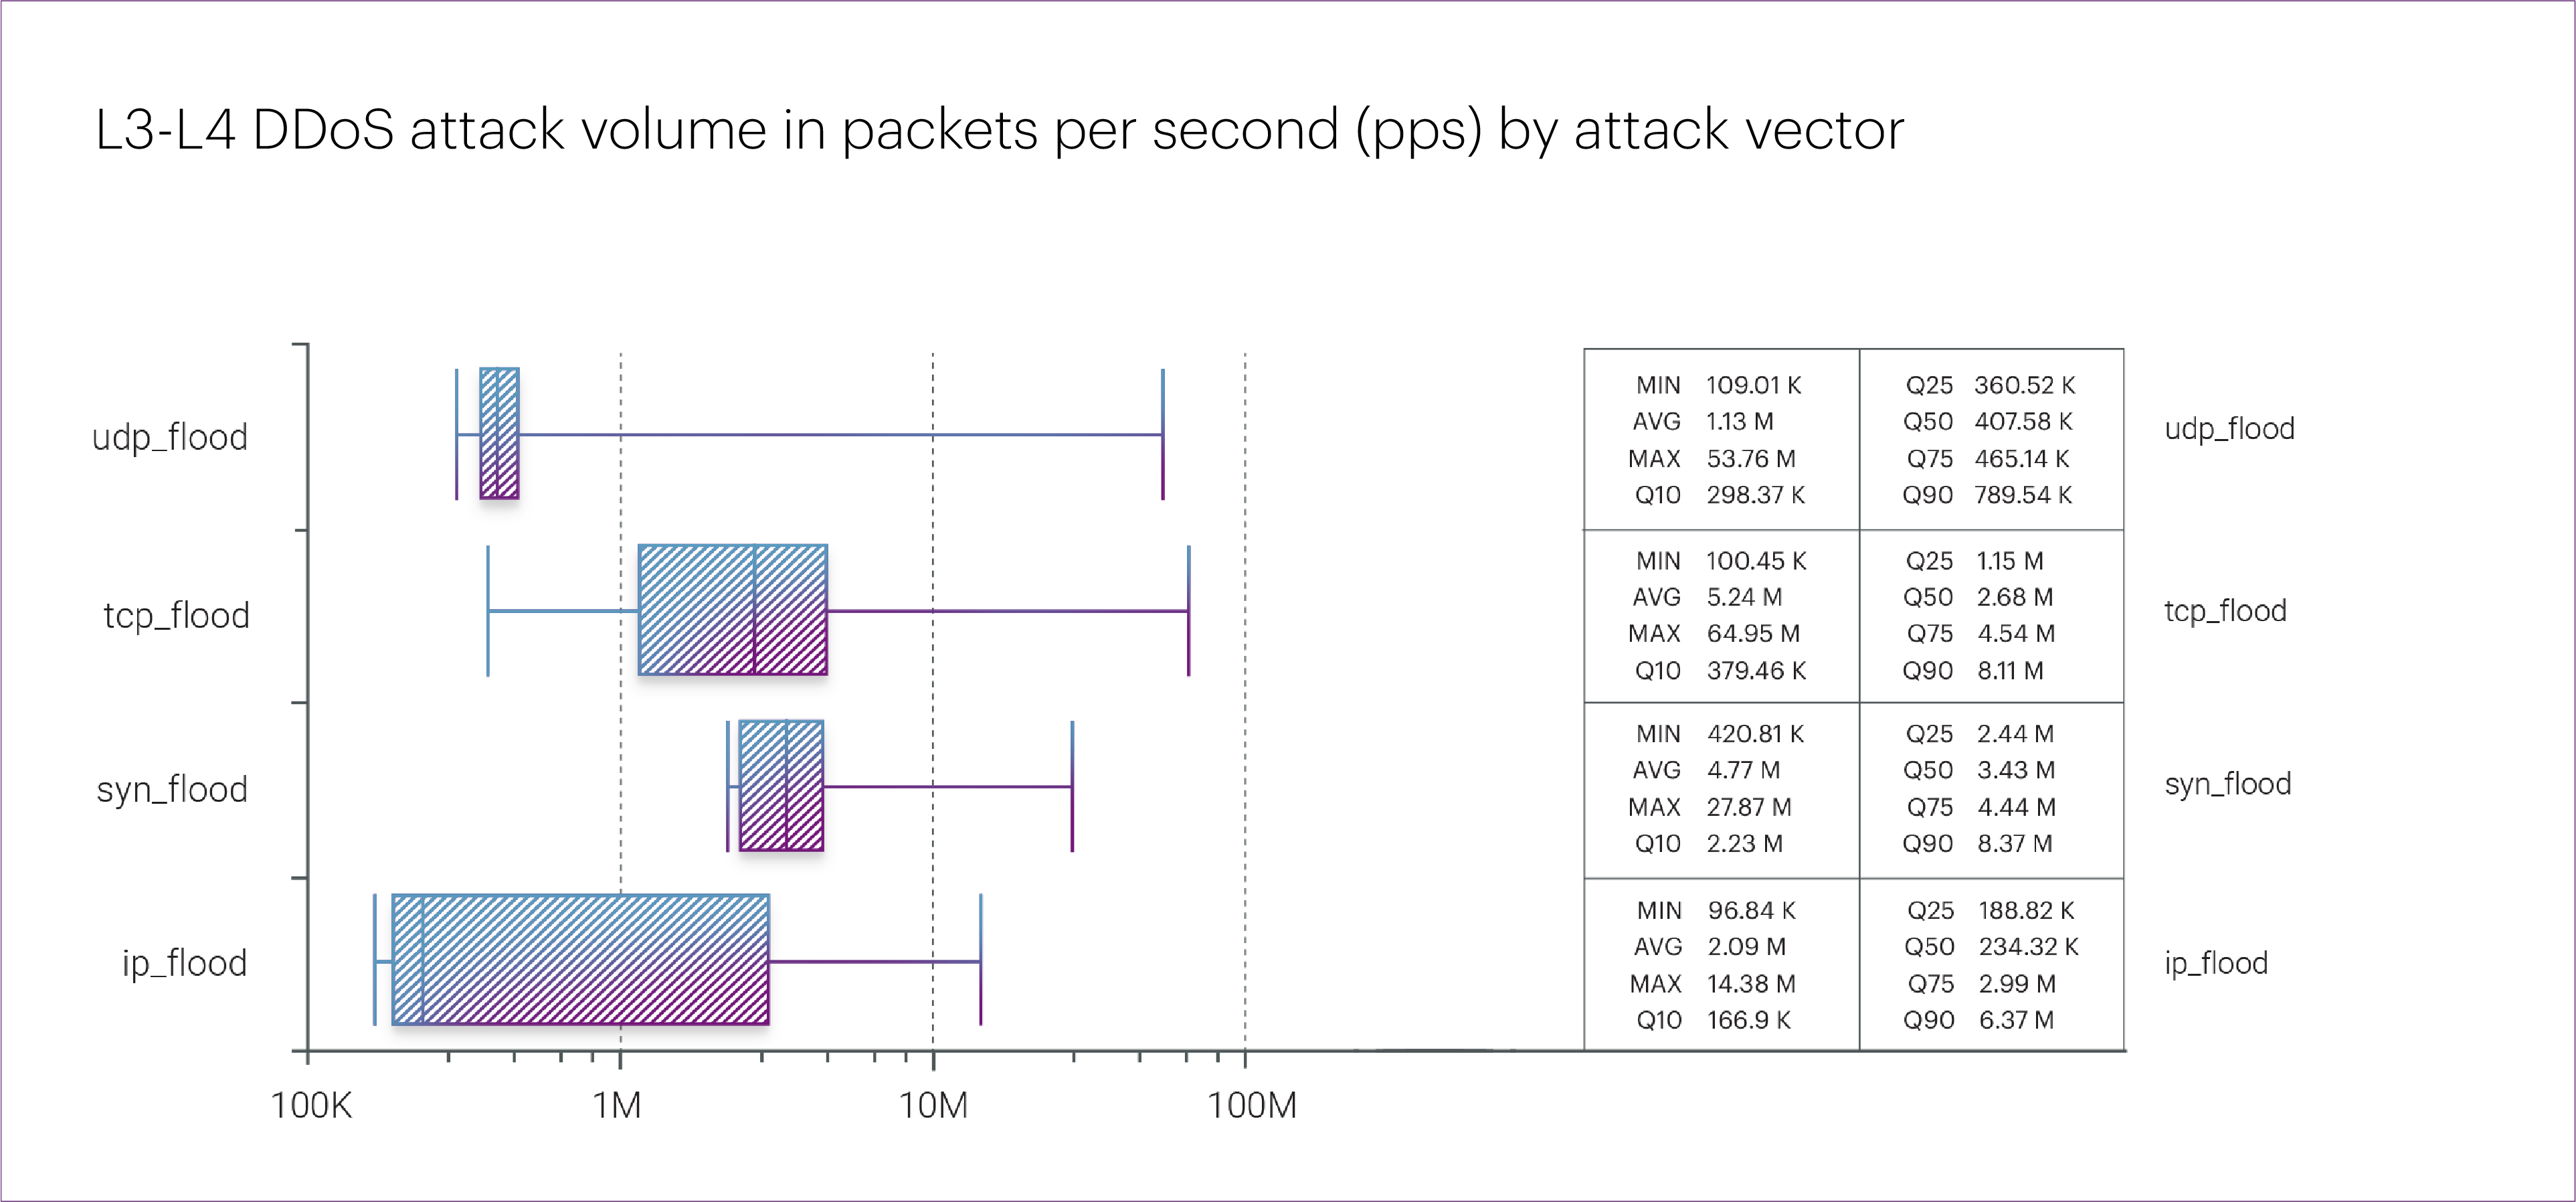
At the same time, it’s important to note that there’s no overall decline in the intensity of L3-L4 DDoS attacks. While Q1 2025 didn’t set any new records for peak attack power, the median bitrate and packet rate both increased compared to 2024.
For instance, UDP flood attacks — which accounted for more than half of all cases in Q1 — saw a 190% increase in median bitrate and a 75% increase in packet rate.
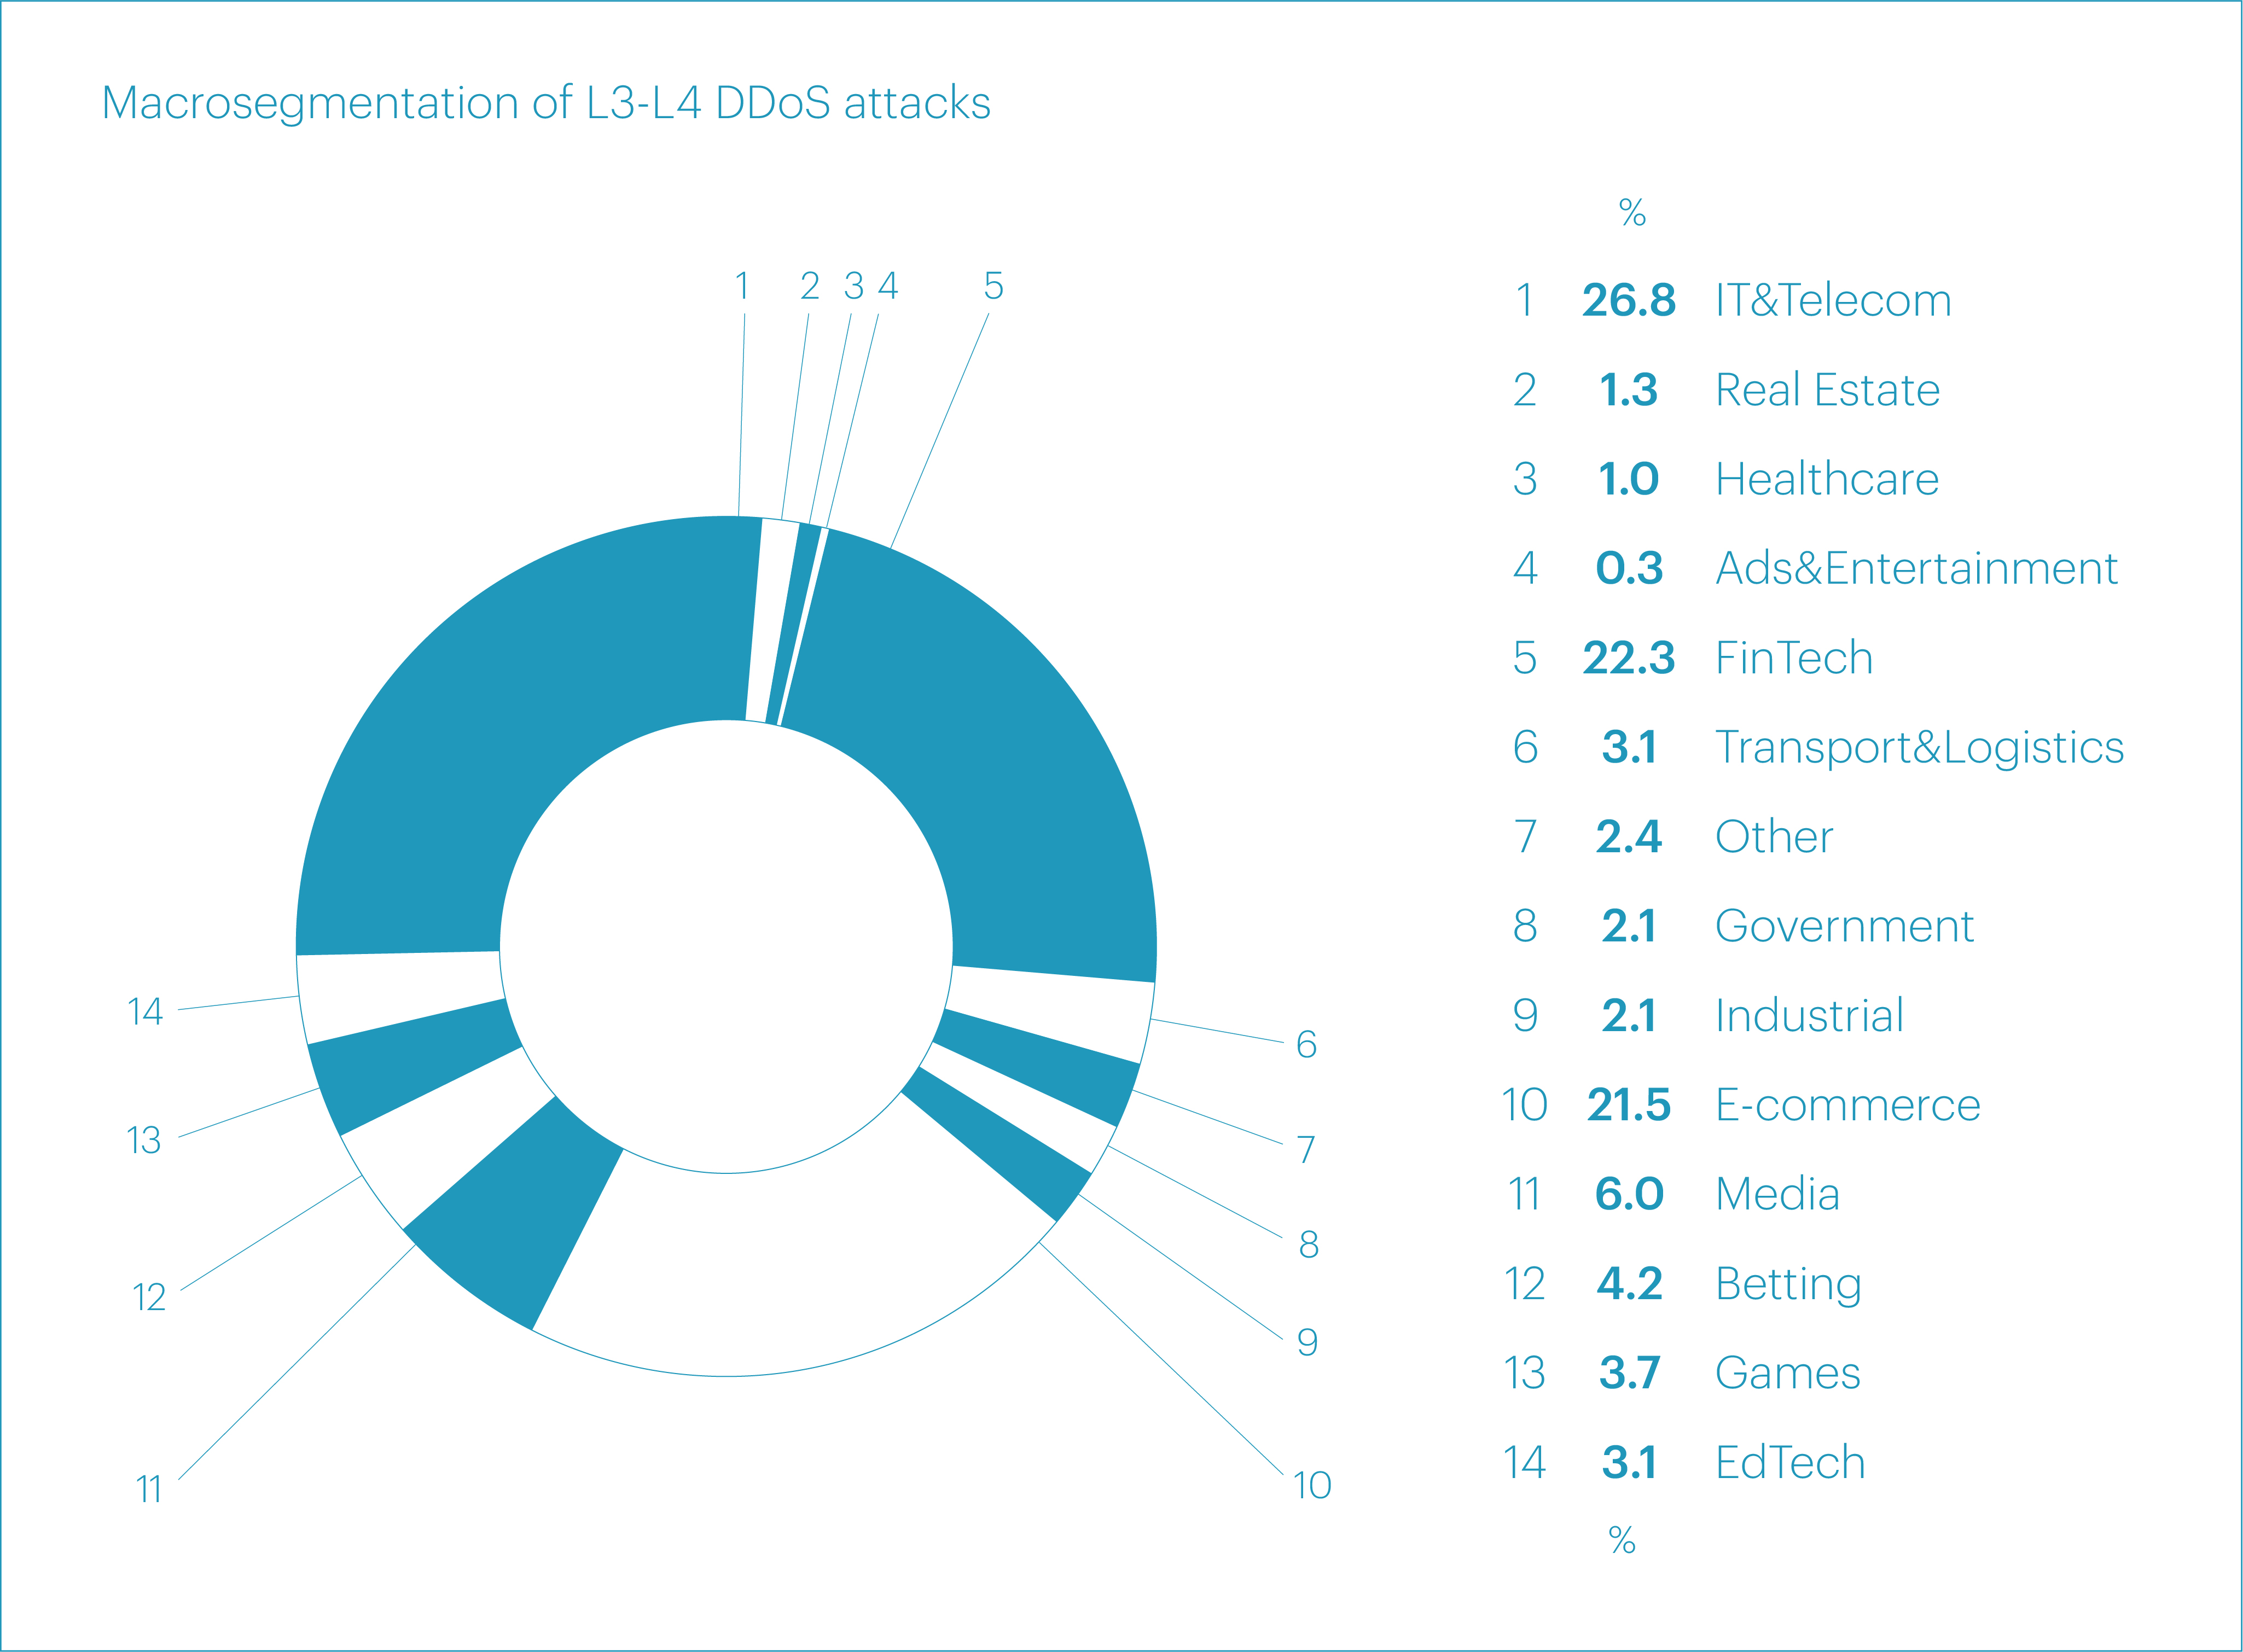
In Q1 2025, most network- and transport-layer DDoS attacks were directed at the “IT&Telecom” (26.8%), “FinTech” (22.3%), and “E-commerce” (21.5%) segments. Altogether, these three accounted for 70% of all L3-L4 attacks recorded during the quarter.
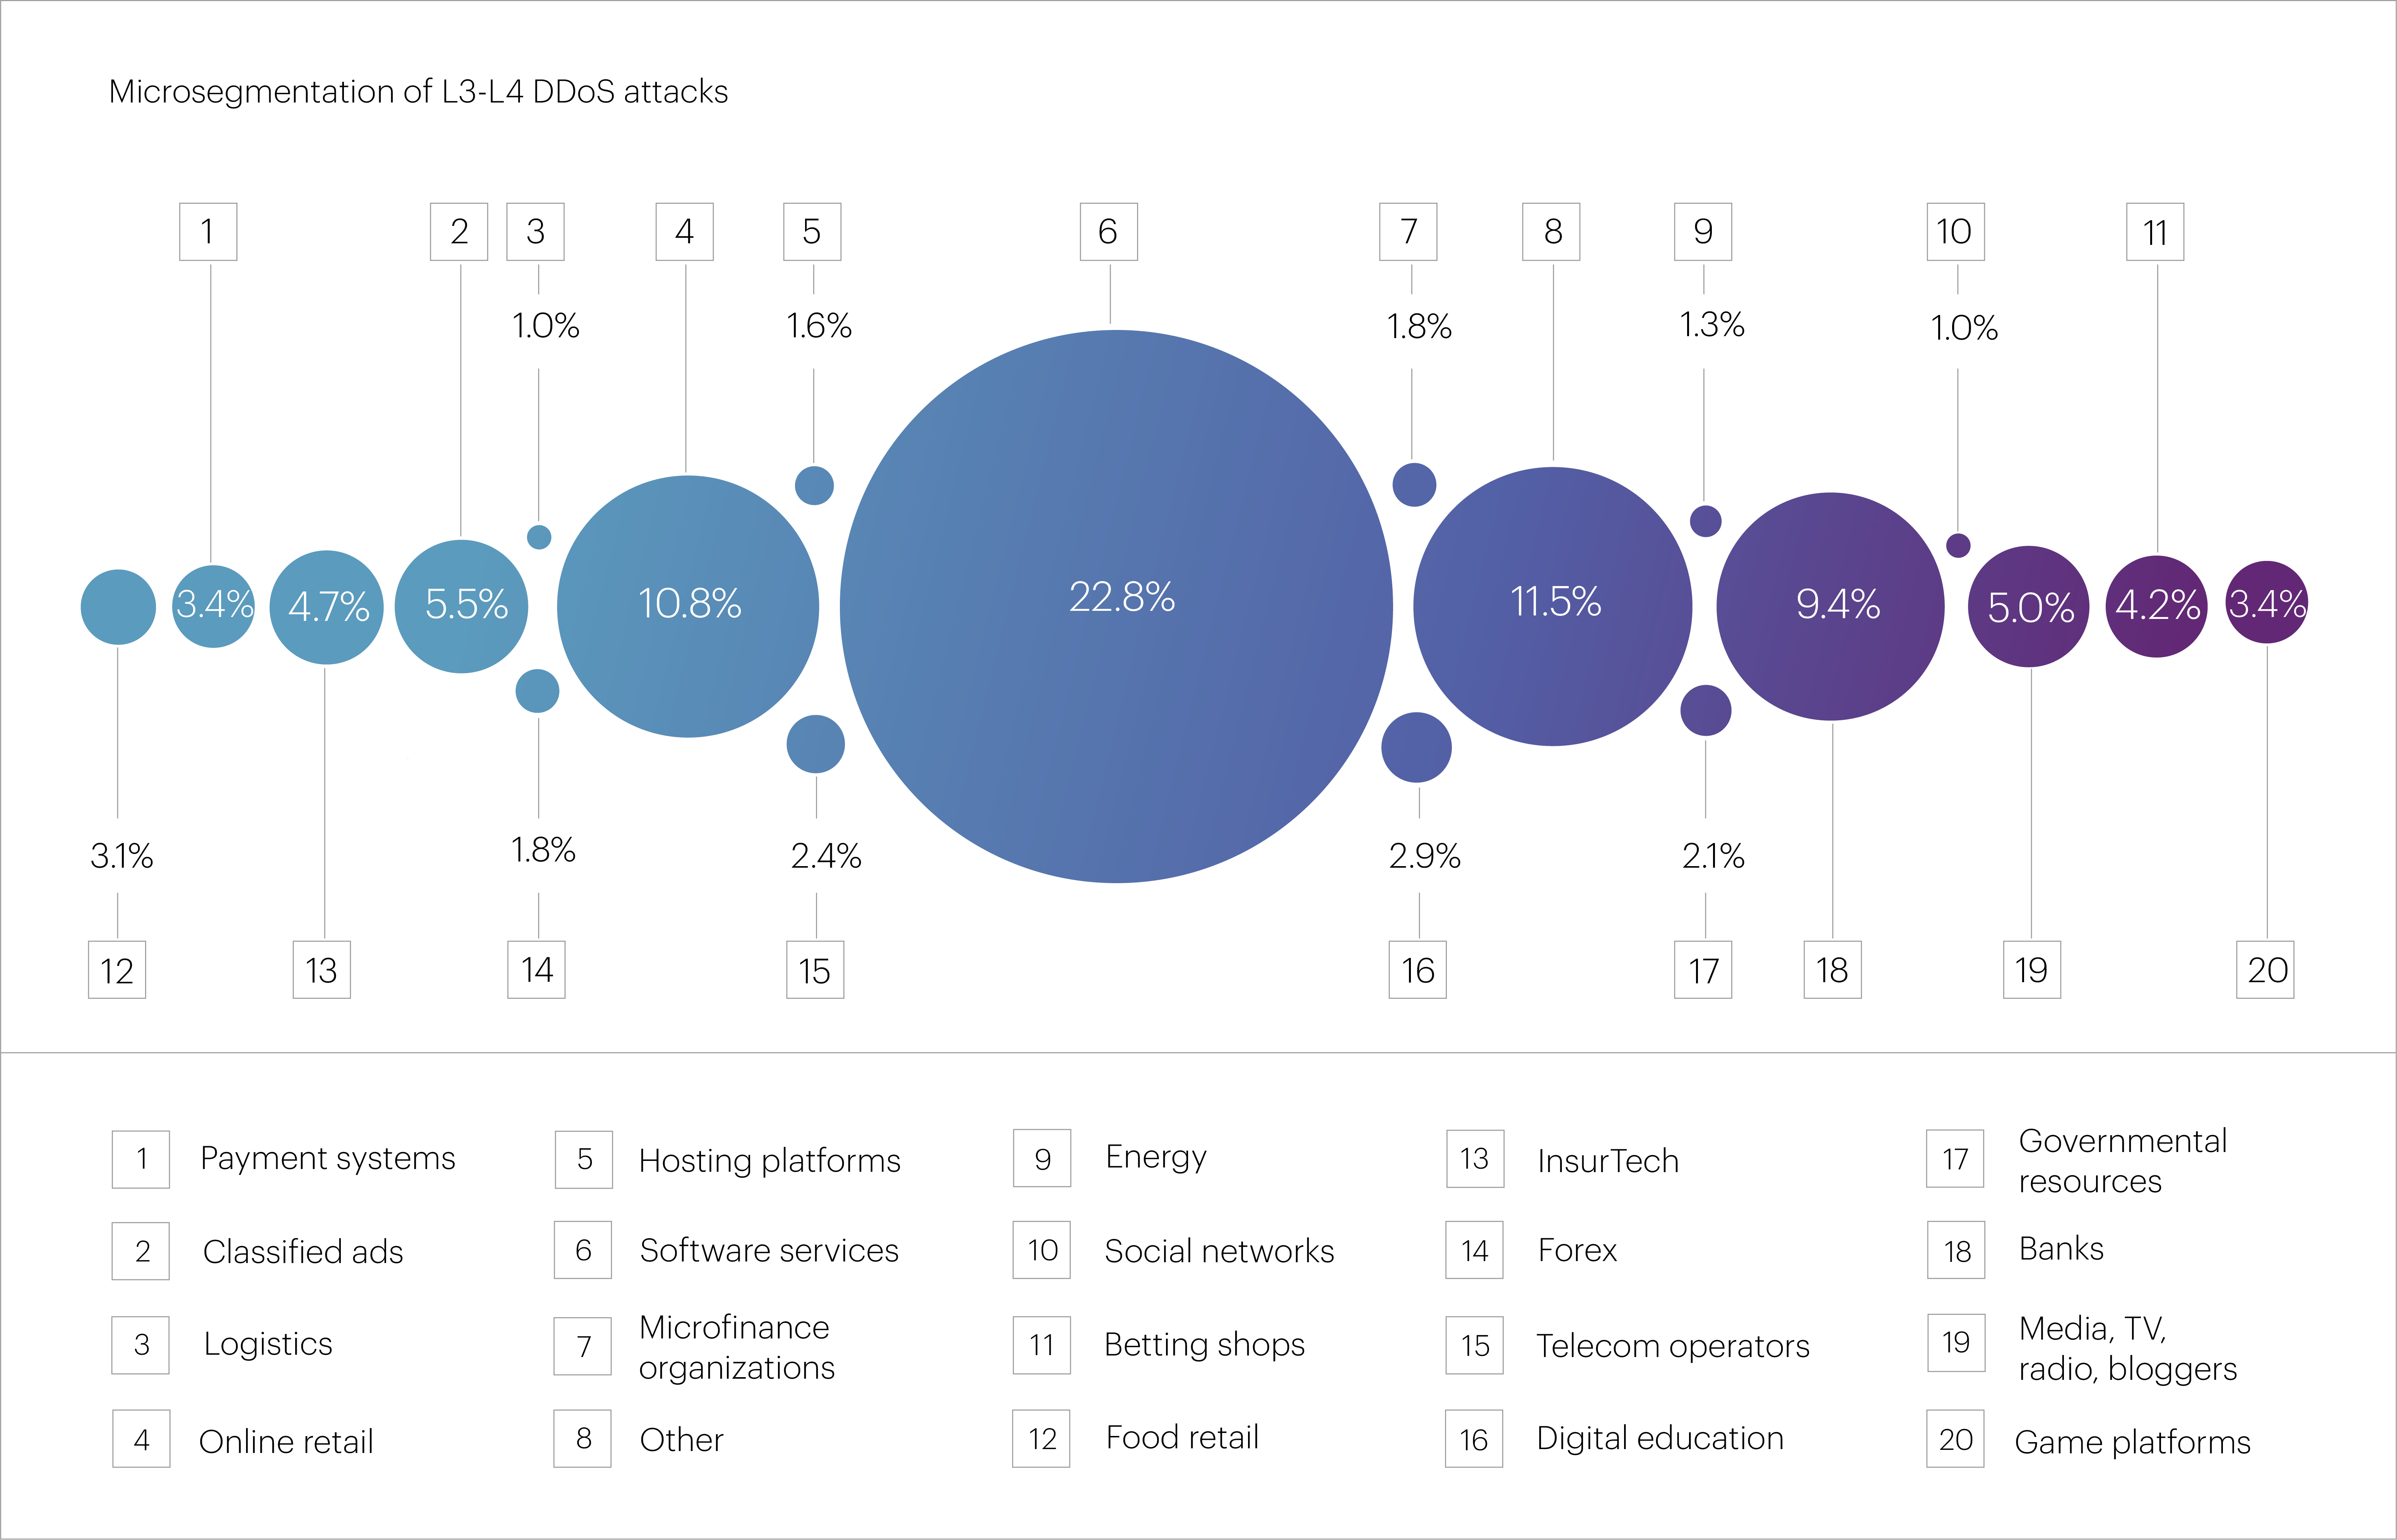
At the microsegment level, the top targets were “Software services” (22.8%), “Online retail” (10.8%), “Banks” (9.4%), “Classified ads” (5.5%), and “Media, TV, radio, bloggers” (5.0%). Combined, these five microsegments represented more than half of all L3-L4 attacks in the past quarter.
The five longest DDoS attacks in the first quarter were relatively short. Leading the list was an attack on the “Oil&Gas” microsegment, which lasted 9.6 hours. Next came an attack on “Classified ads” (5 hours), followed by incidents targeting “Telecom operators” (2.2 hours), “InsurTech” (1.5 hours), and “Media, TV, radio, bloggers” (1.3 hours).
For comparison, the longest attack in 2024 targeted the “Online retail” microsegment and lasted nearly three weeks — 463.9 hours. Against this backdrop, the Q1 2025 figures appear rather modest.
The top five microsegments hit by the most powerful L3-L4 DDoS attacks in Q1 2025 were led by “Betting shops” (232 Gbps), followed by a significant gap: “InsurTech” (134 Gbps), “Entertainment portals” (132 Gbps), “Classified ads” (129 Gbps), and “Online retail” (117 Gbps).
The top five microsegments by peak packet rate look quite different. “Banks” led with 65 Mpps, followed by “Betting shops” (54 Mpps), “Payment systems” (33 Mpps), “InsurTech” (28 Mpps), and “Hosting platforms” (17 Mpps).
As mentioned earlier, these are relatively low values — both compared to 2024 as a whole and specifically to its first quarter.
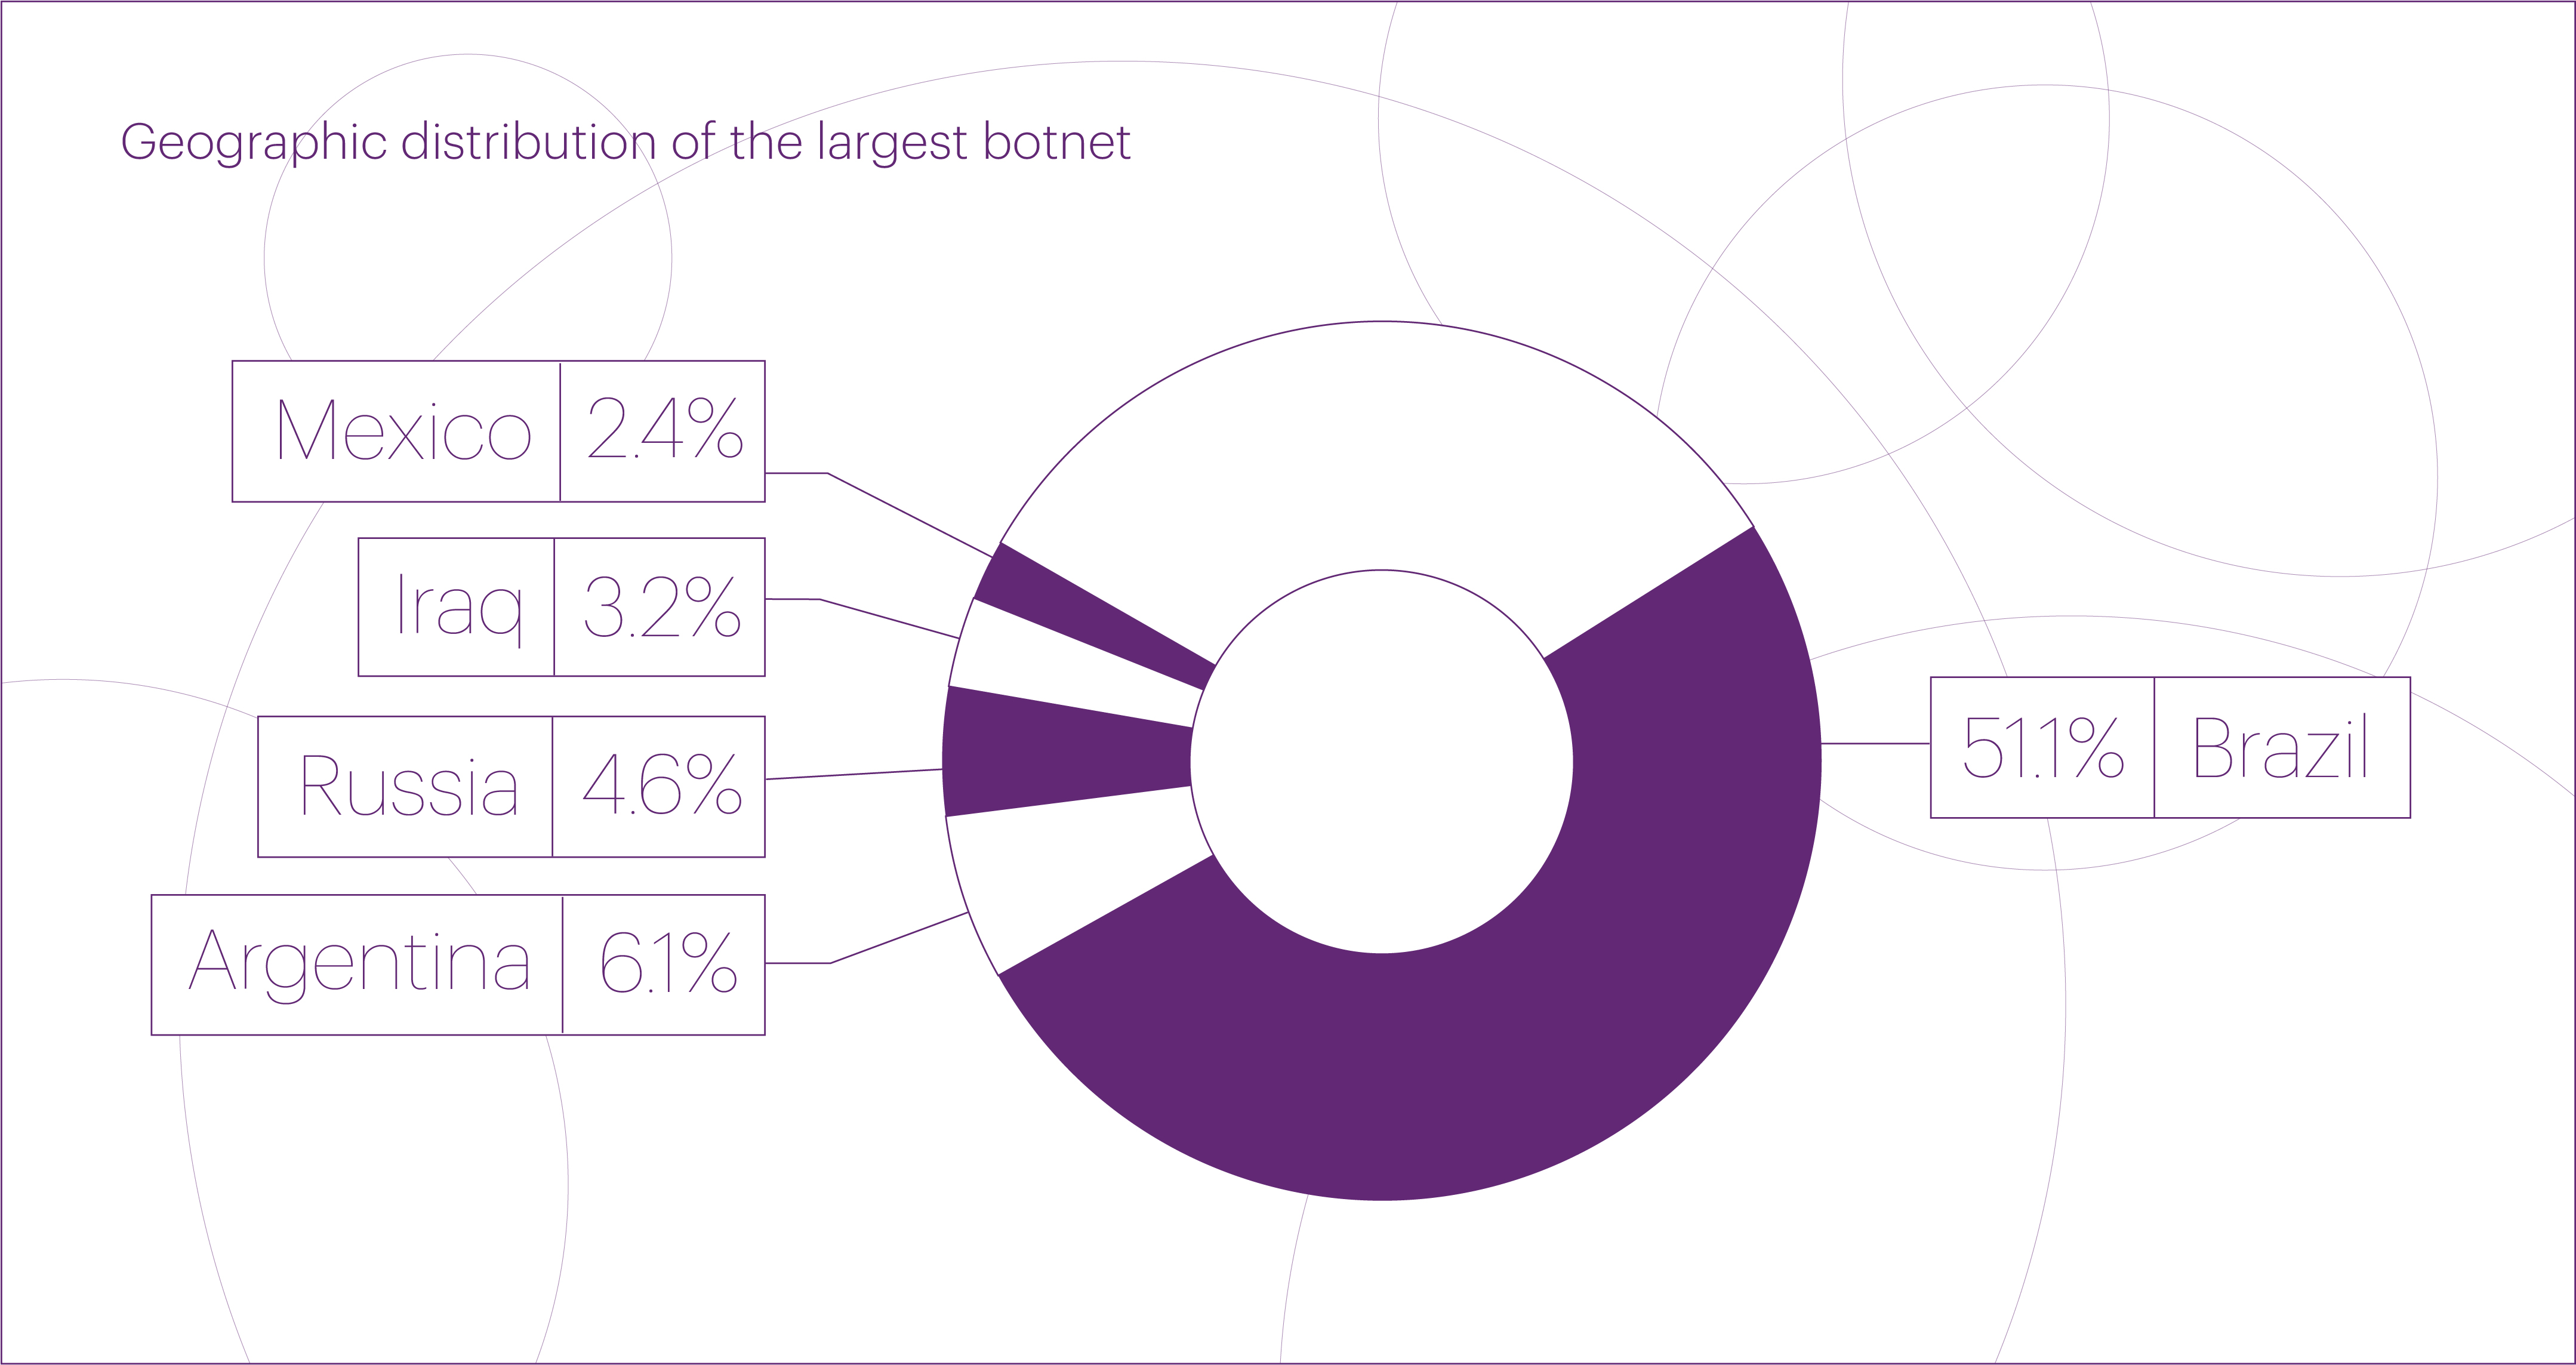
On March 26, 2025 — just before the end of the first quarter — we detected an attack from a massive DDoS botnet that broke previous records by a wide margin. The DDoS botnet included 1.33 million devices, nearly six times larger than the biggest one seen in 2024 (227,000 devices) and almost ten times the size of the 2023 record (136,000 devices).

The attack targeted the “Betting shops” microsegment and lasted approximately 2.5 hours. The botnet was primarily composed of devices located in Brazil (51.1%), Argentina (6.1%), Russia (4.6%), Iraq (3.2%), and Mexico (2.4%). It might seem that such attacks with a high concentration of sources in a single country can be easily mitigated using geo-blocking. However, in practice, bot operators are usually prepared for this and can quickly switch to IP addresses from other regions.
This botnet closely resembles the largest one we detected last year. It fits perfectly into the trend we highlighted in our 2024 report: the rise of massive DDoS botnets built from devices located in developing countries.
We attribute this trend to the slow pace of replacing outdated devices that no longer receive security updates, combined with steadily improving connectivity. These conditions are especially prevalent in developing regions due to economic constraints.
The result is a perfect storm: millions of vulnerable devices with fast internet access form an ideal foundation for large botnets — which are increasingly being used to launch high-scale DDoS attacks.
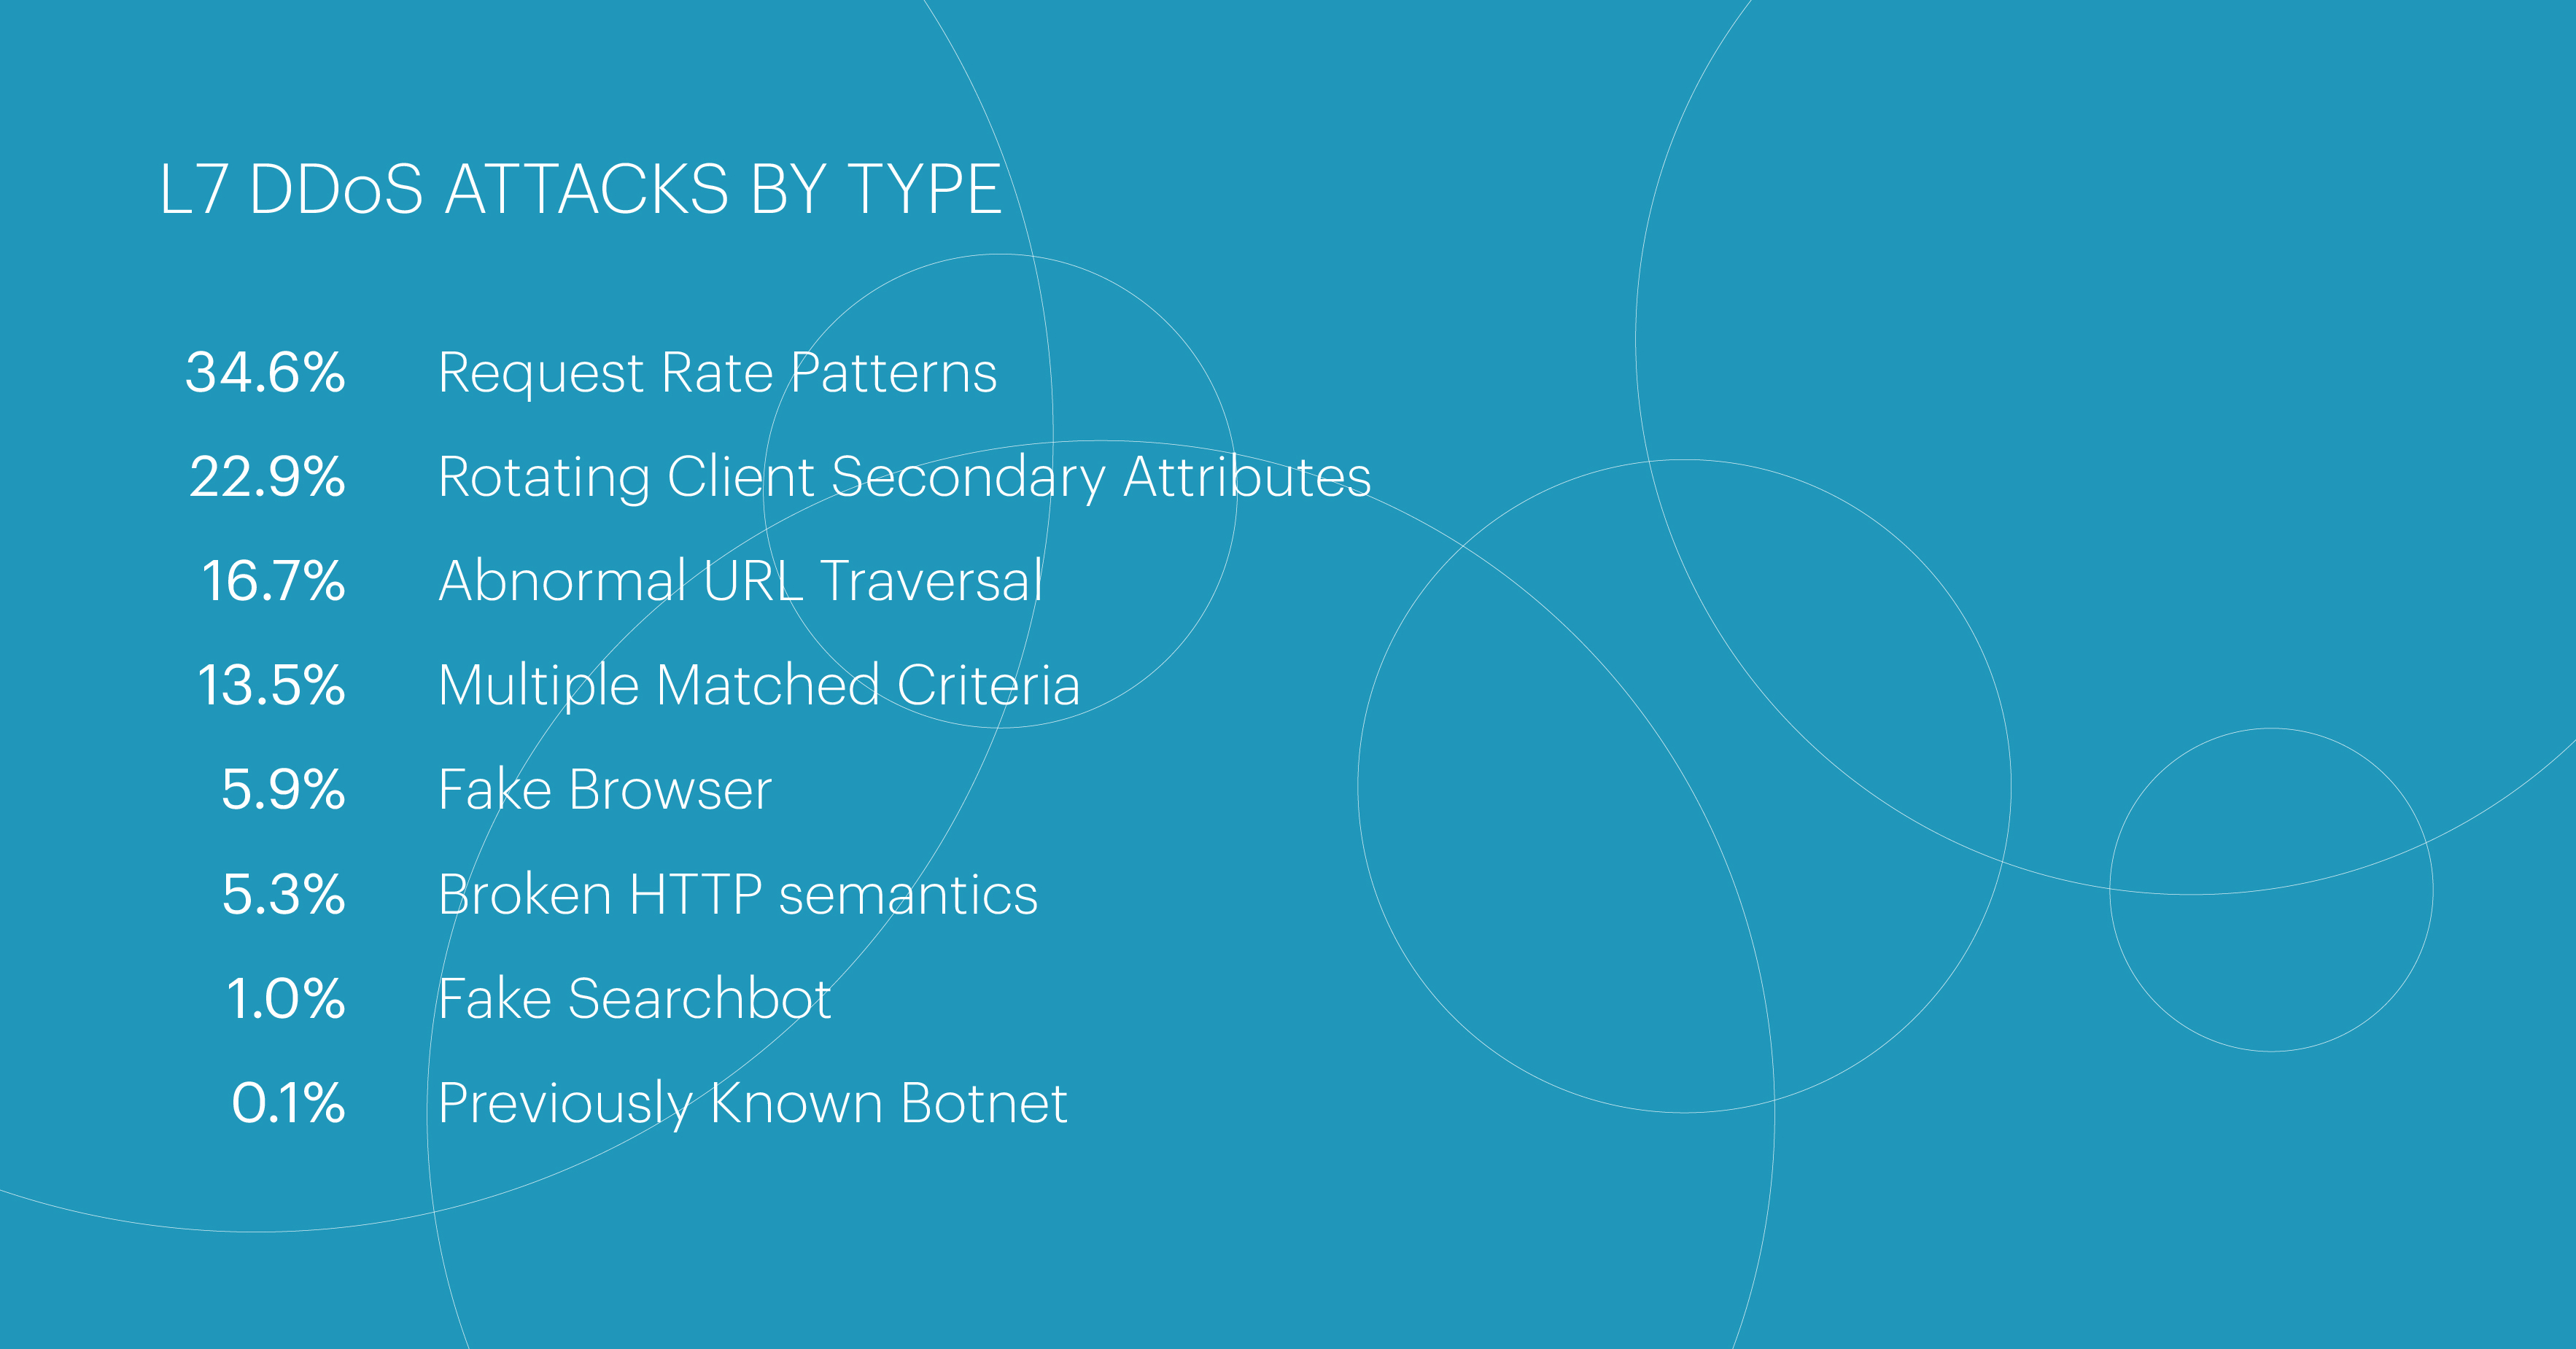
The number of L7 DDoS attacks in Q1 2025 remained roughly the same as in the first quarter of the previous year. The most common attack class was Request Rate Patterns (34.6%) — attacks characterized by request frequency that deviates from the expected behavior of legitimate users.
In second place were Rotating Client Secondary Attributes attacks (22.9%) with unusual sets of headers in the request. Third were Abnormal URL Traversal attacks (16.7%), which involve actions that legitimate users often wouldn’t be able to perform at all.
The largest share of L7 DDoS attacks targeted the “FinTech” macrosegment, which saw rapid growth throughout the previous year — its share rose from 22.6% of all attacks in Q1 2024 to 54.0% in Q1 2025.
“E-commerce” ranked second with 14.4%, followed by “IT&Telecom” with 8.1%.
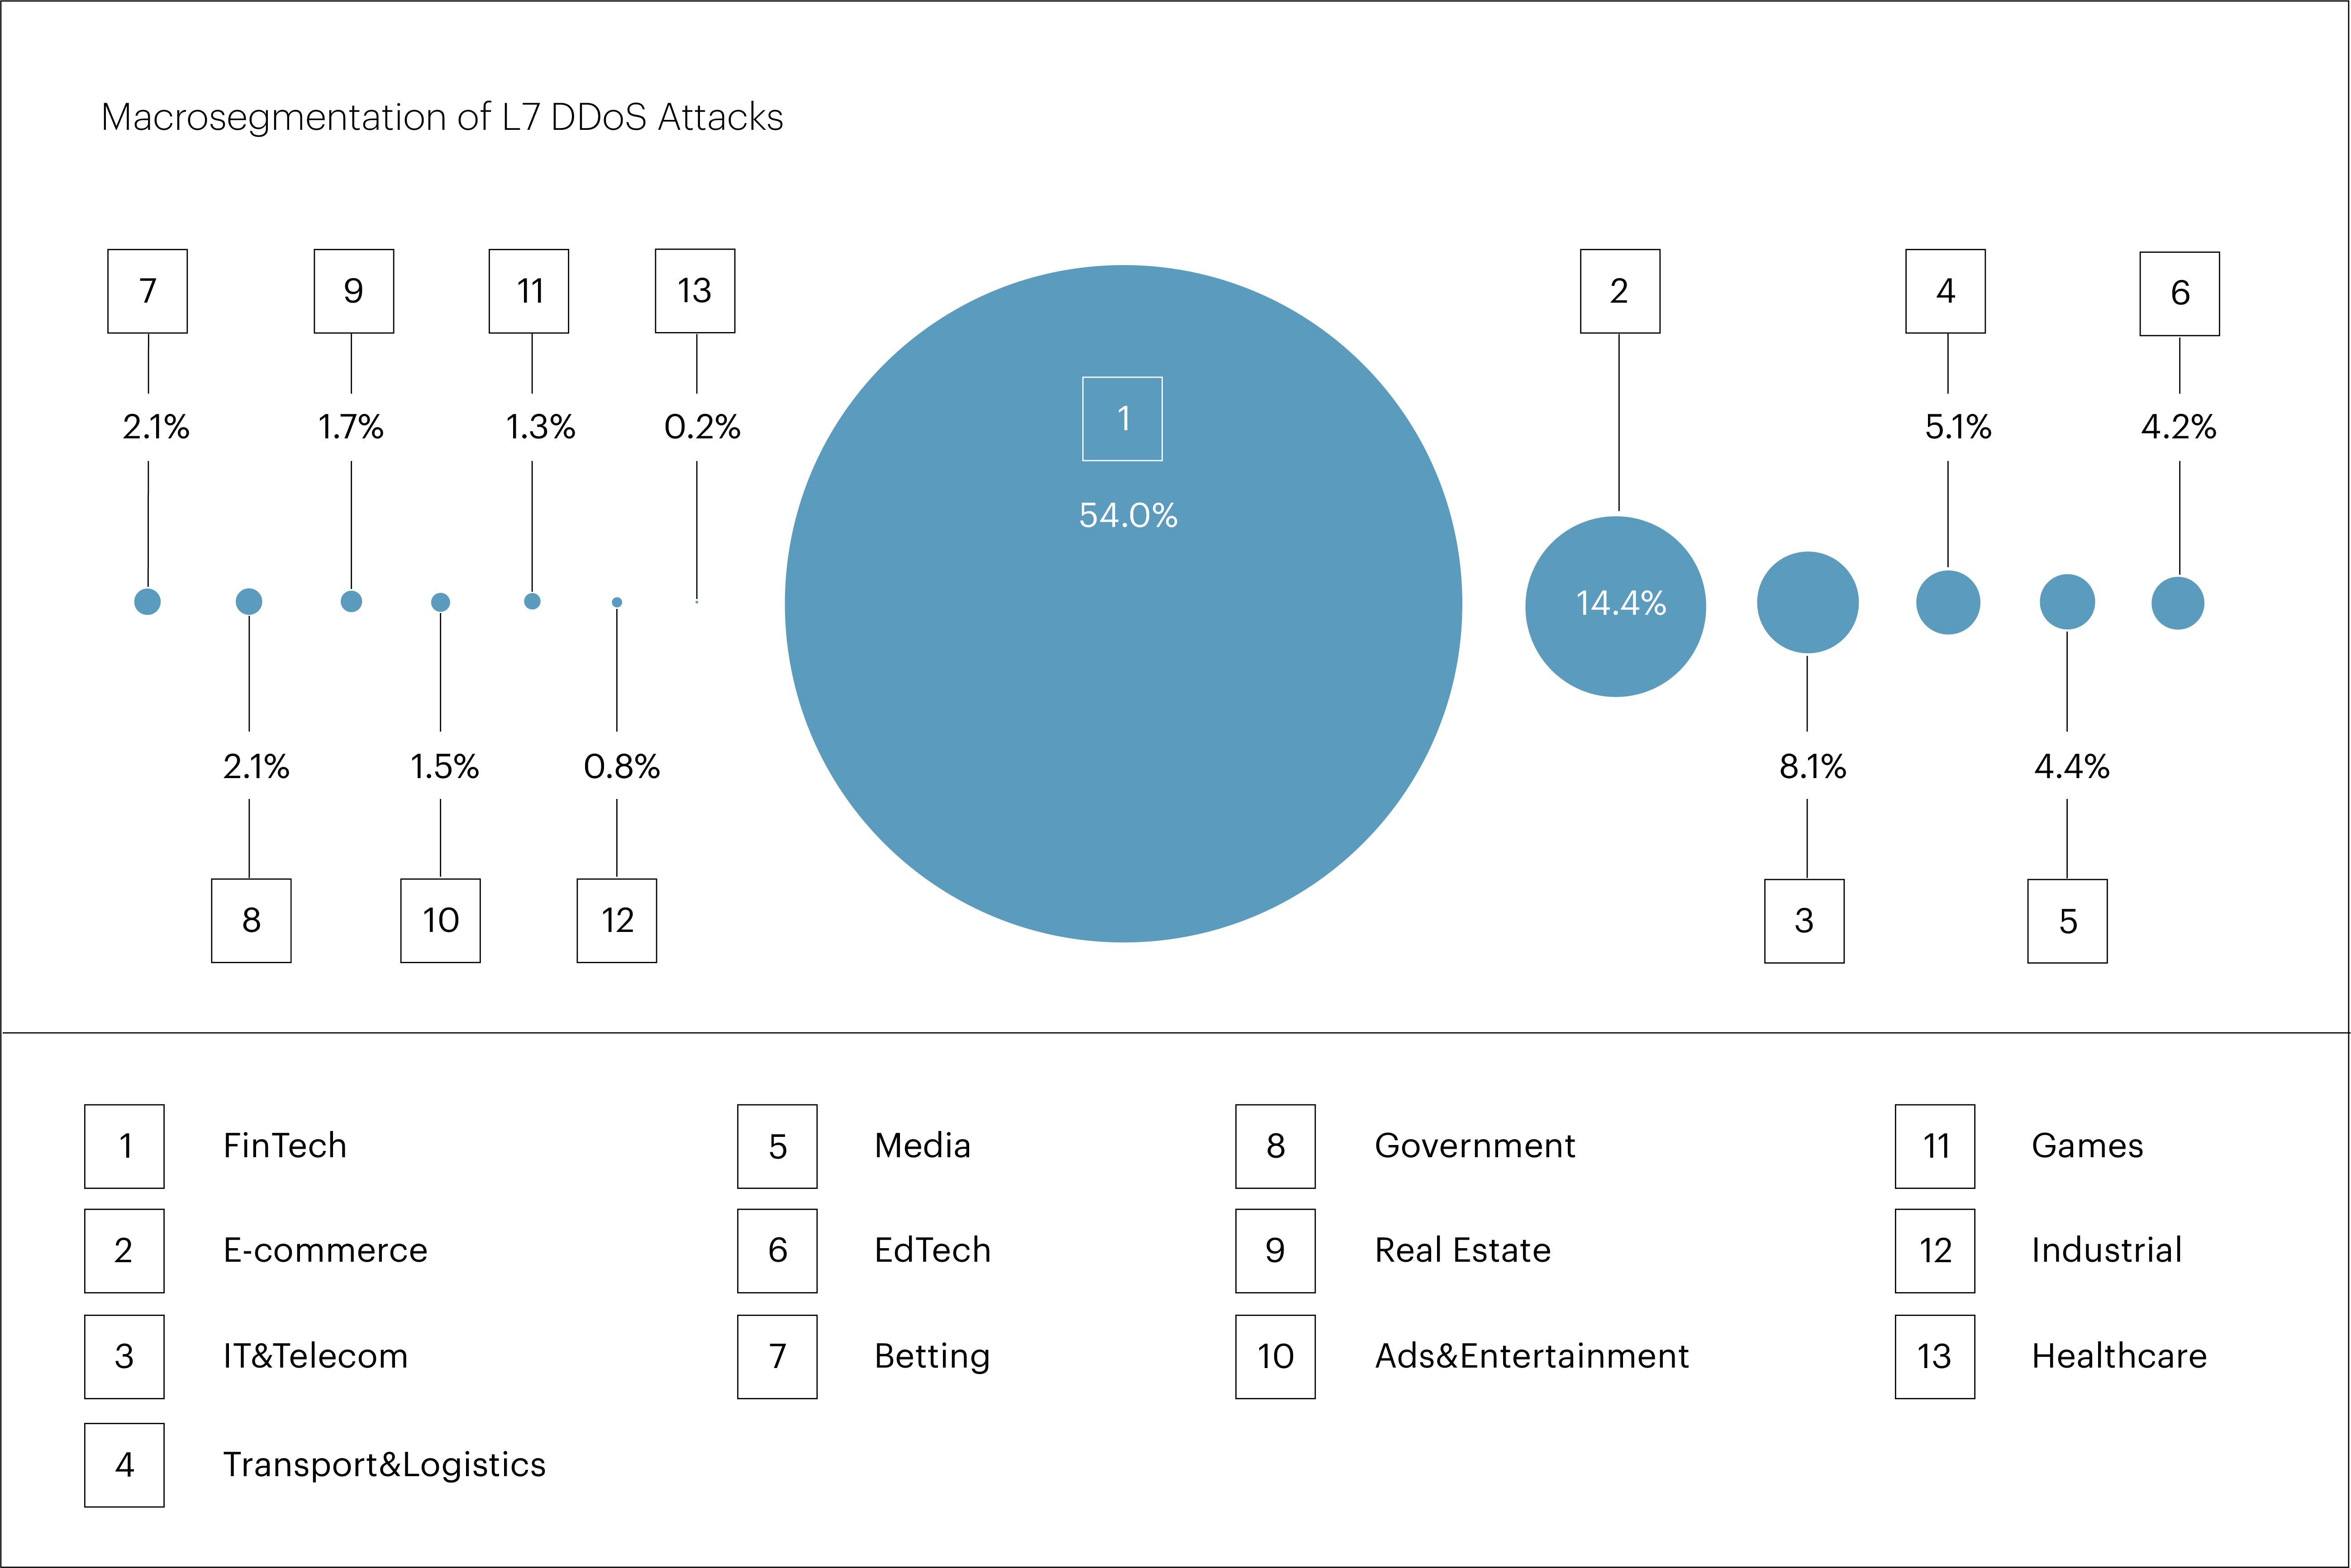
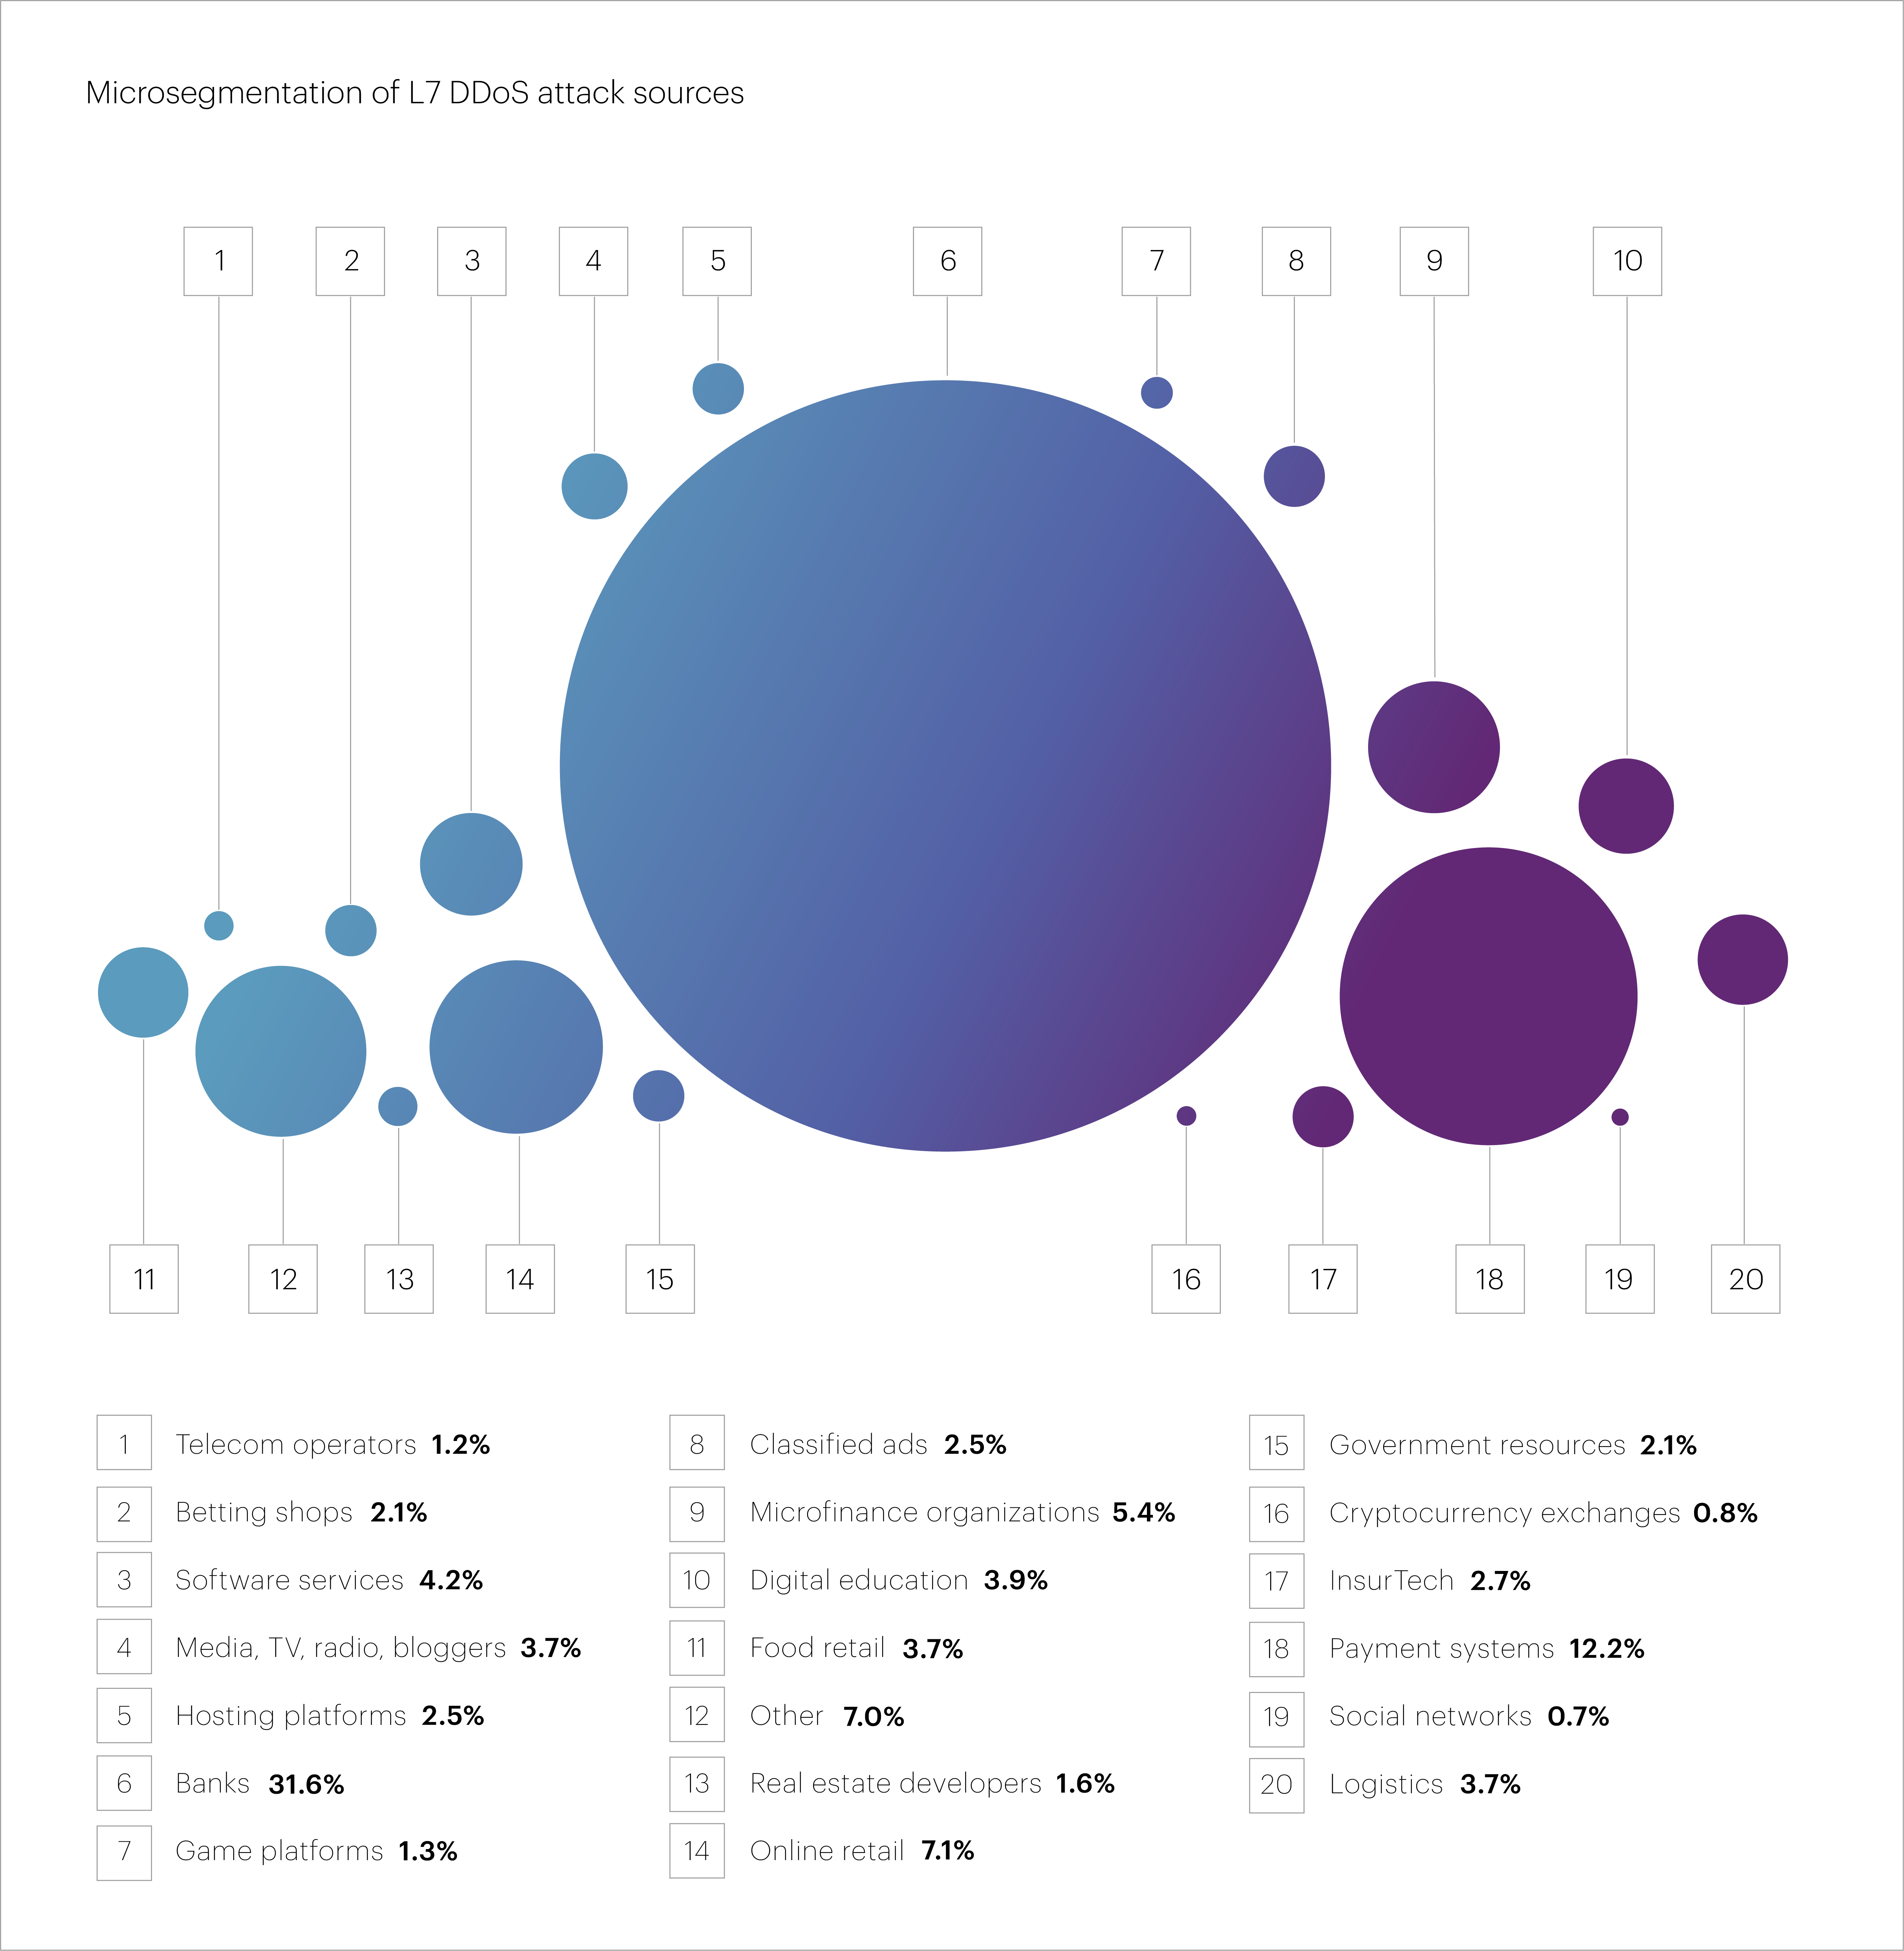
Among microsegments, the most frequently targeted was “Banks,” which also saw a sharp increase — from 13.7% to 31.6% over the year. It was followed by “Payment systems” (12.2%), “Online retail” (7.1%), “Microfinance organizations” (5.4%), and “Software services” (4.2%).
The two longest application-layer attacks in Q1 2025 targeted an organization in the “Cryptocurrency exchanges” microsegment. The first one began on February 12 and lasted 22 hours. Just a few hours after it ended, a second attack followed on February 13, lasting approximately 30 hours.
The third-longest attack of the quarter hit the “Software services” microsegment. It started on February 24 and continued for 18.7 hours. For comparison, the longest application layer attack in 2024 lasted about 49 hours. In that context, Q1 2025 has not set any new records so far.
The top three source countries for L7 DDoS attacks in Q1 2025 remained unchanged from 2024: Russia (28.2%), the United States (14.4%), and Brazil (6.1%).
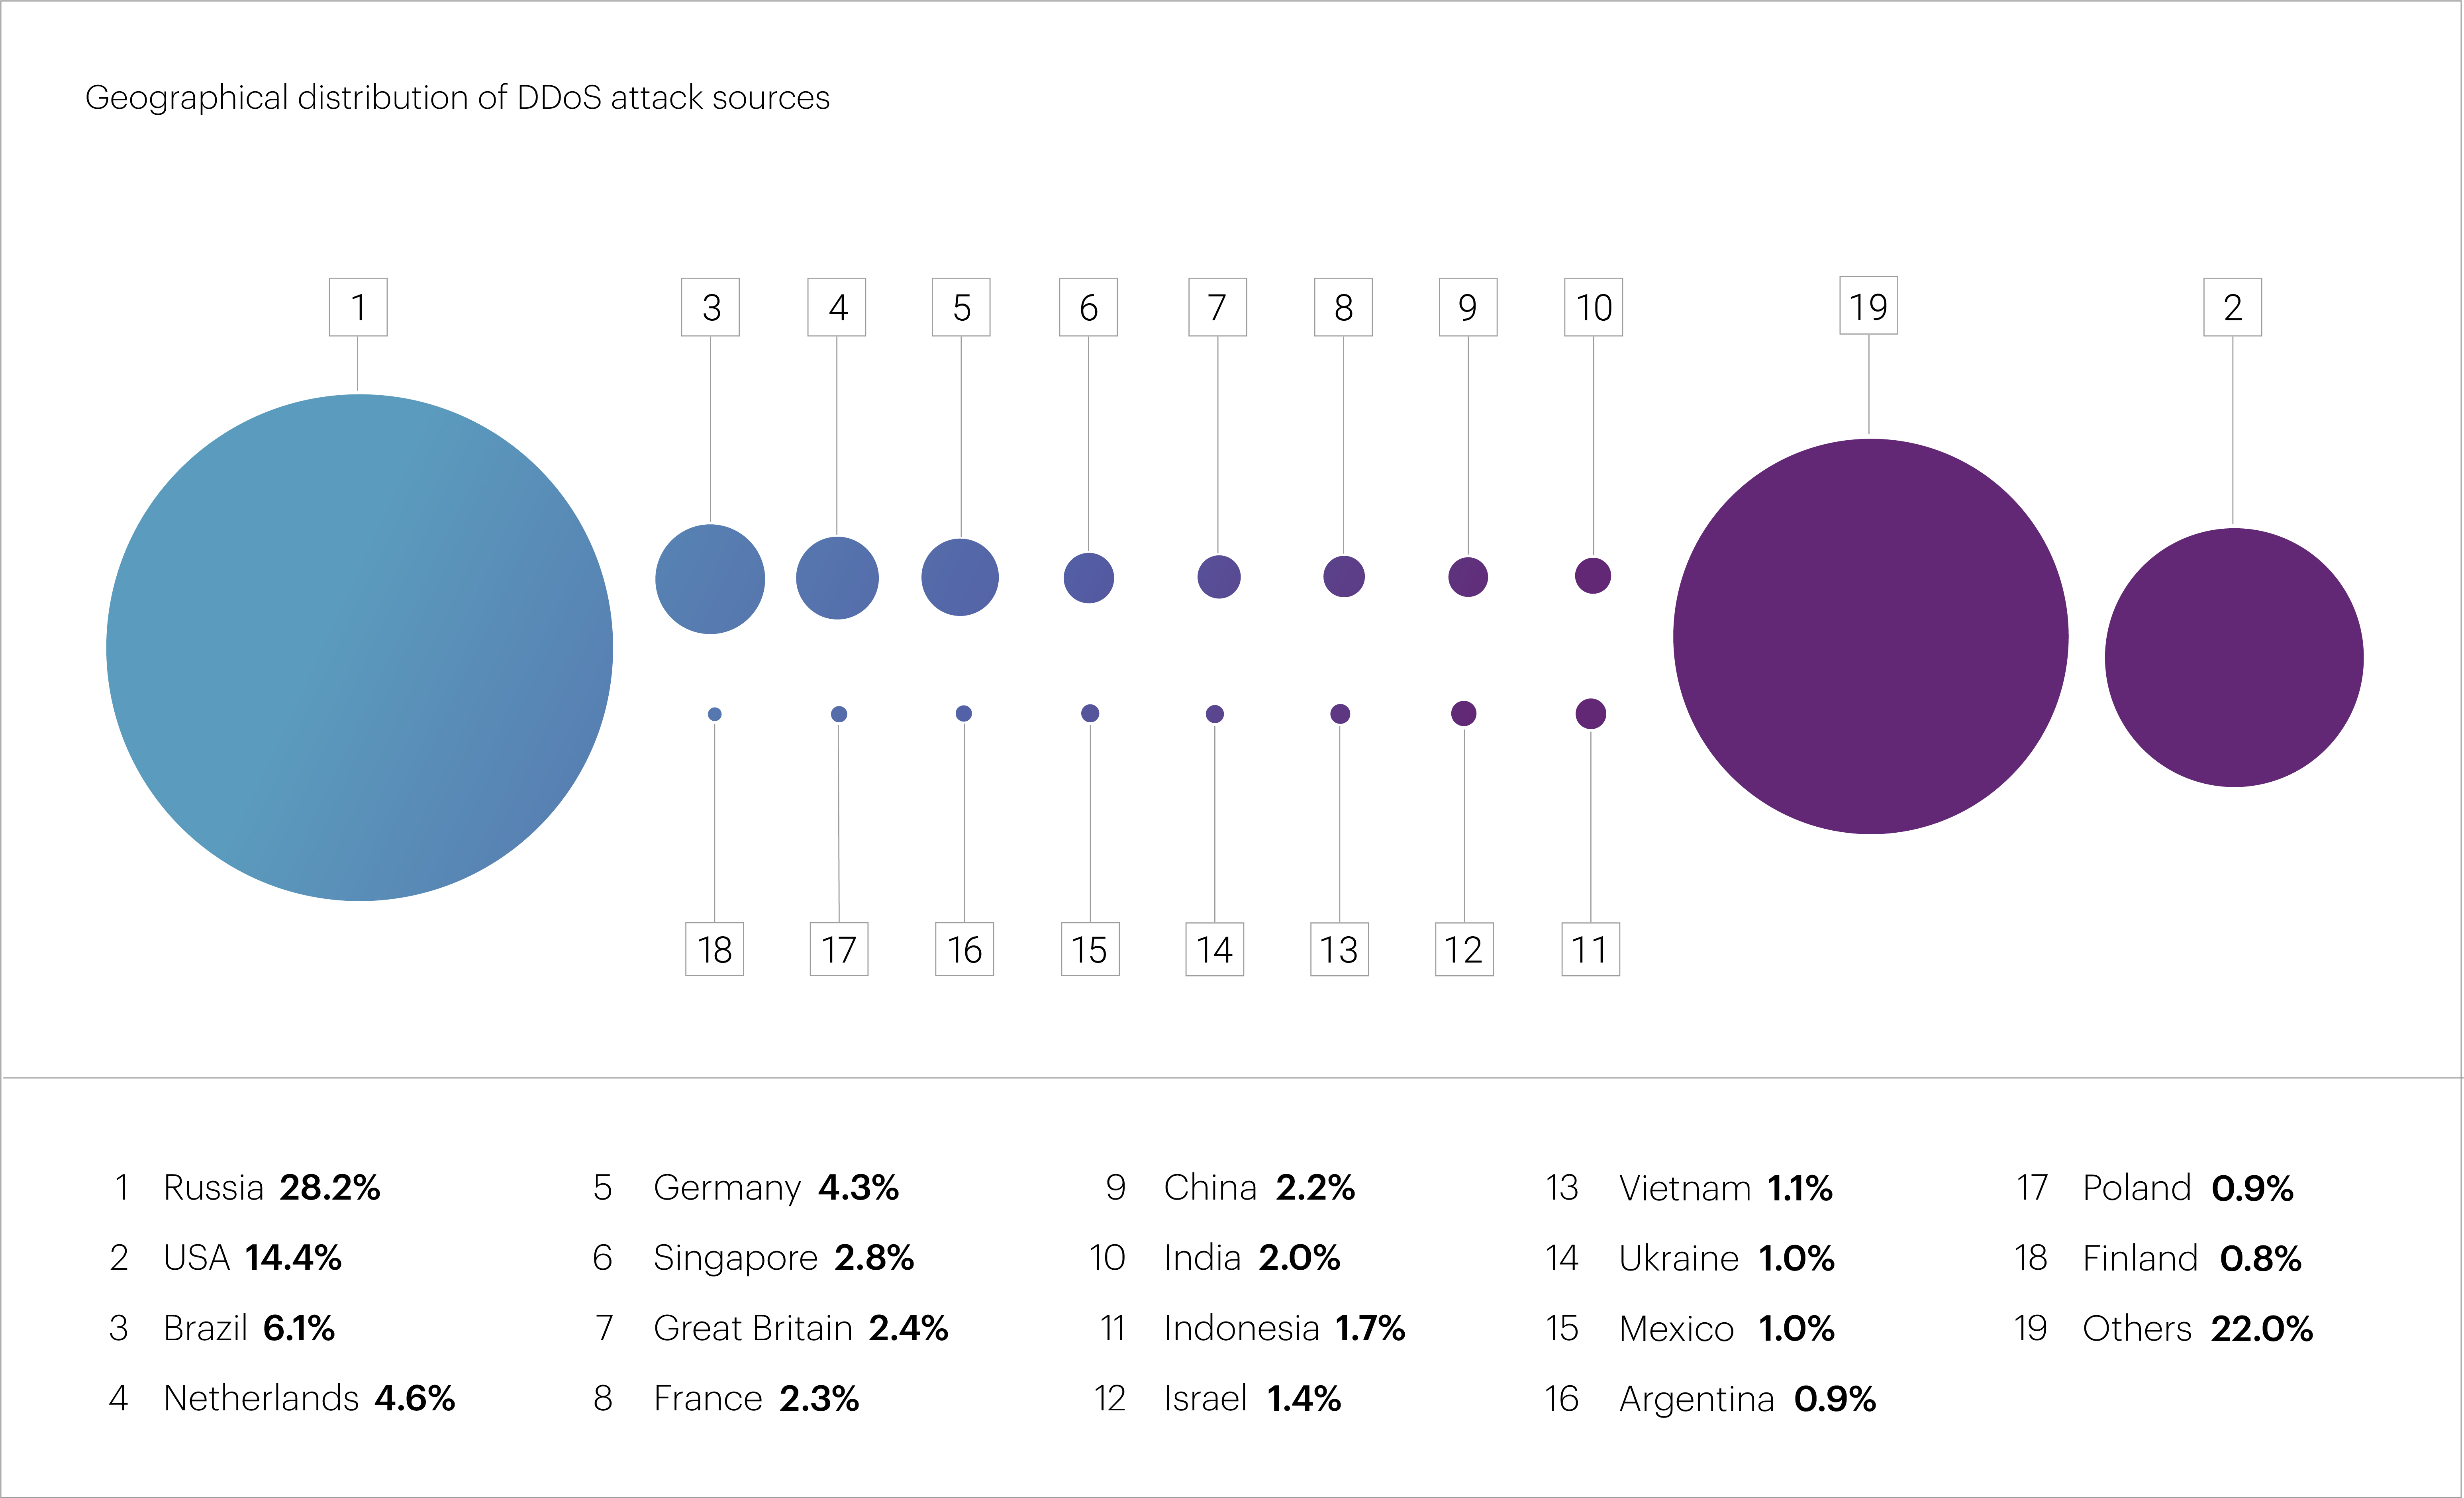
Rounding out the top 10 were the Netherlands (4.6%), Germany (4.3%), Singapore (2.8%), the United Kingdom (2.4%), France (2.3%), China (2.2%), and India (2.0%). Combined, these countries accounted for approximately 70% of all blocked IP addresses.
To avoid confusion, it’s important to clarify that “bad” bots refer to automated systems that mimic real users when interacting with websites. Unlike DDoS bots, their goal isn’t to disrupt service but to carry out activities like data scraping, manipulating metrics, brute-forcing login credentials, and other forms of abuse.
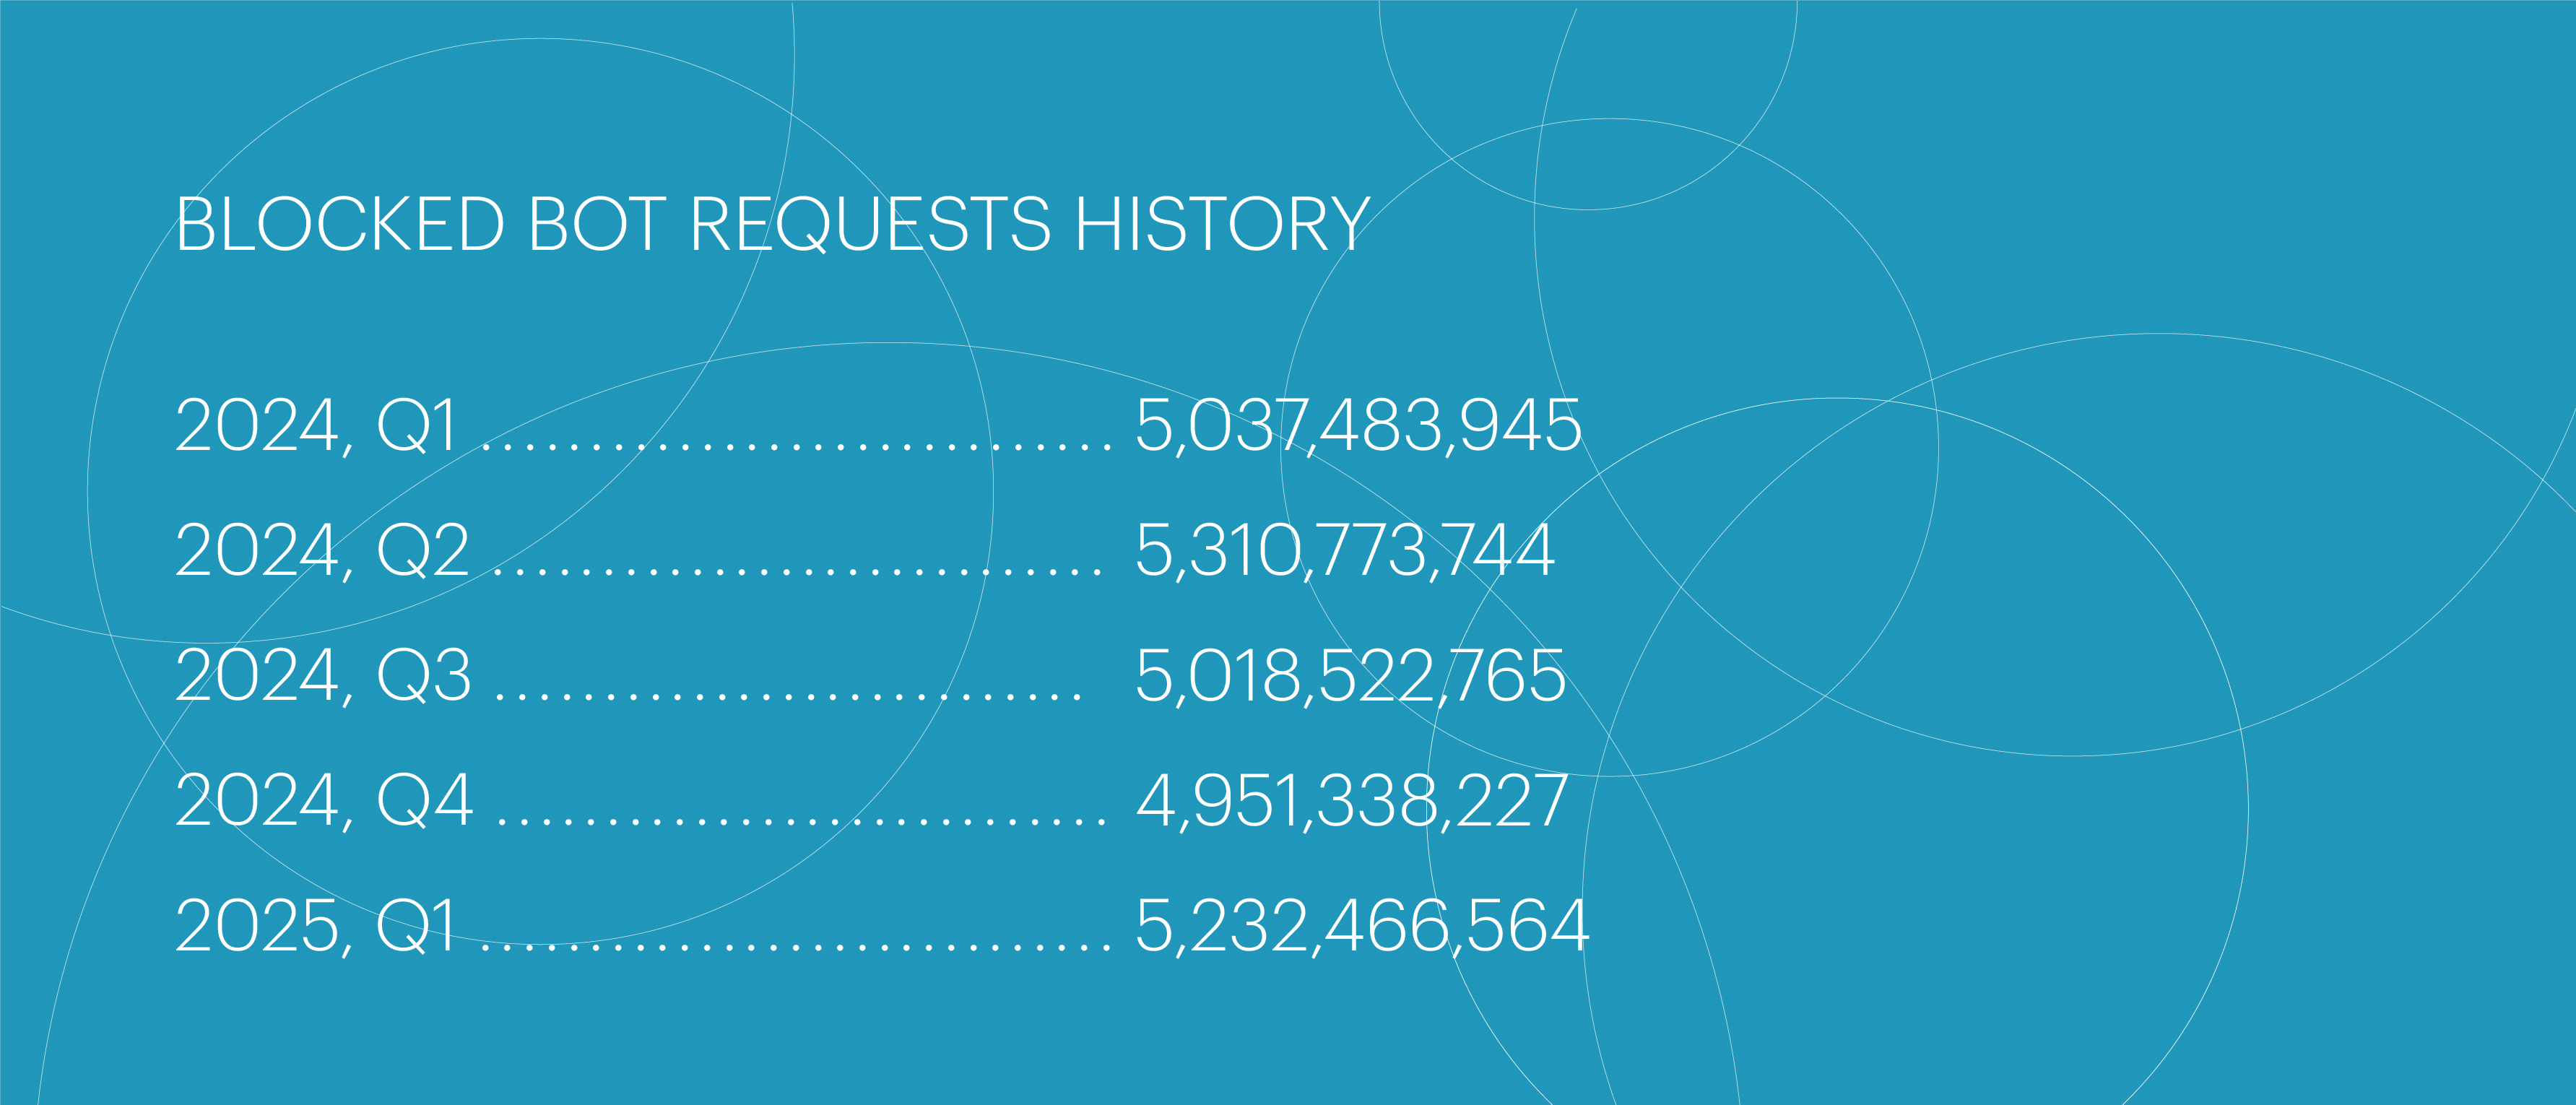
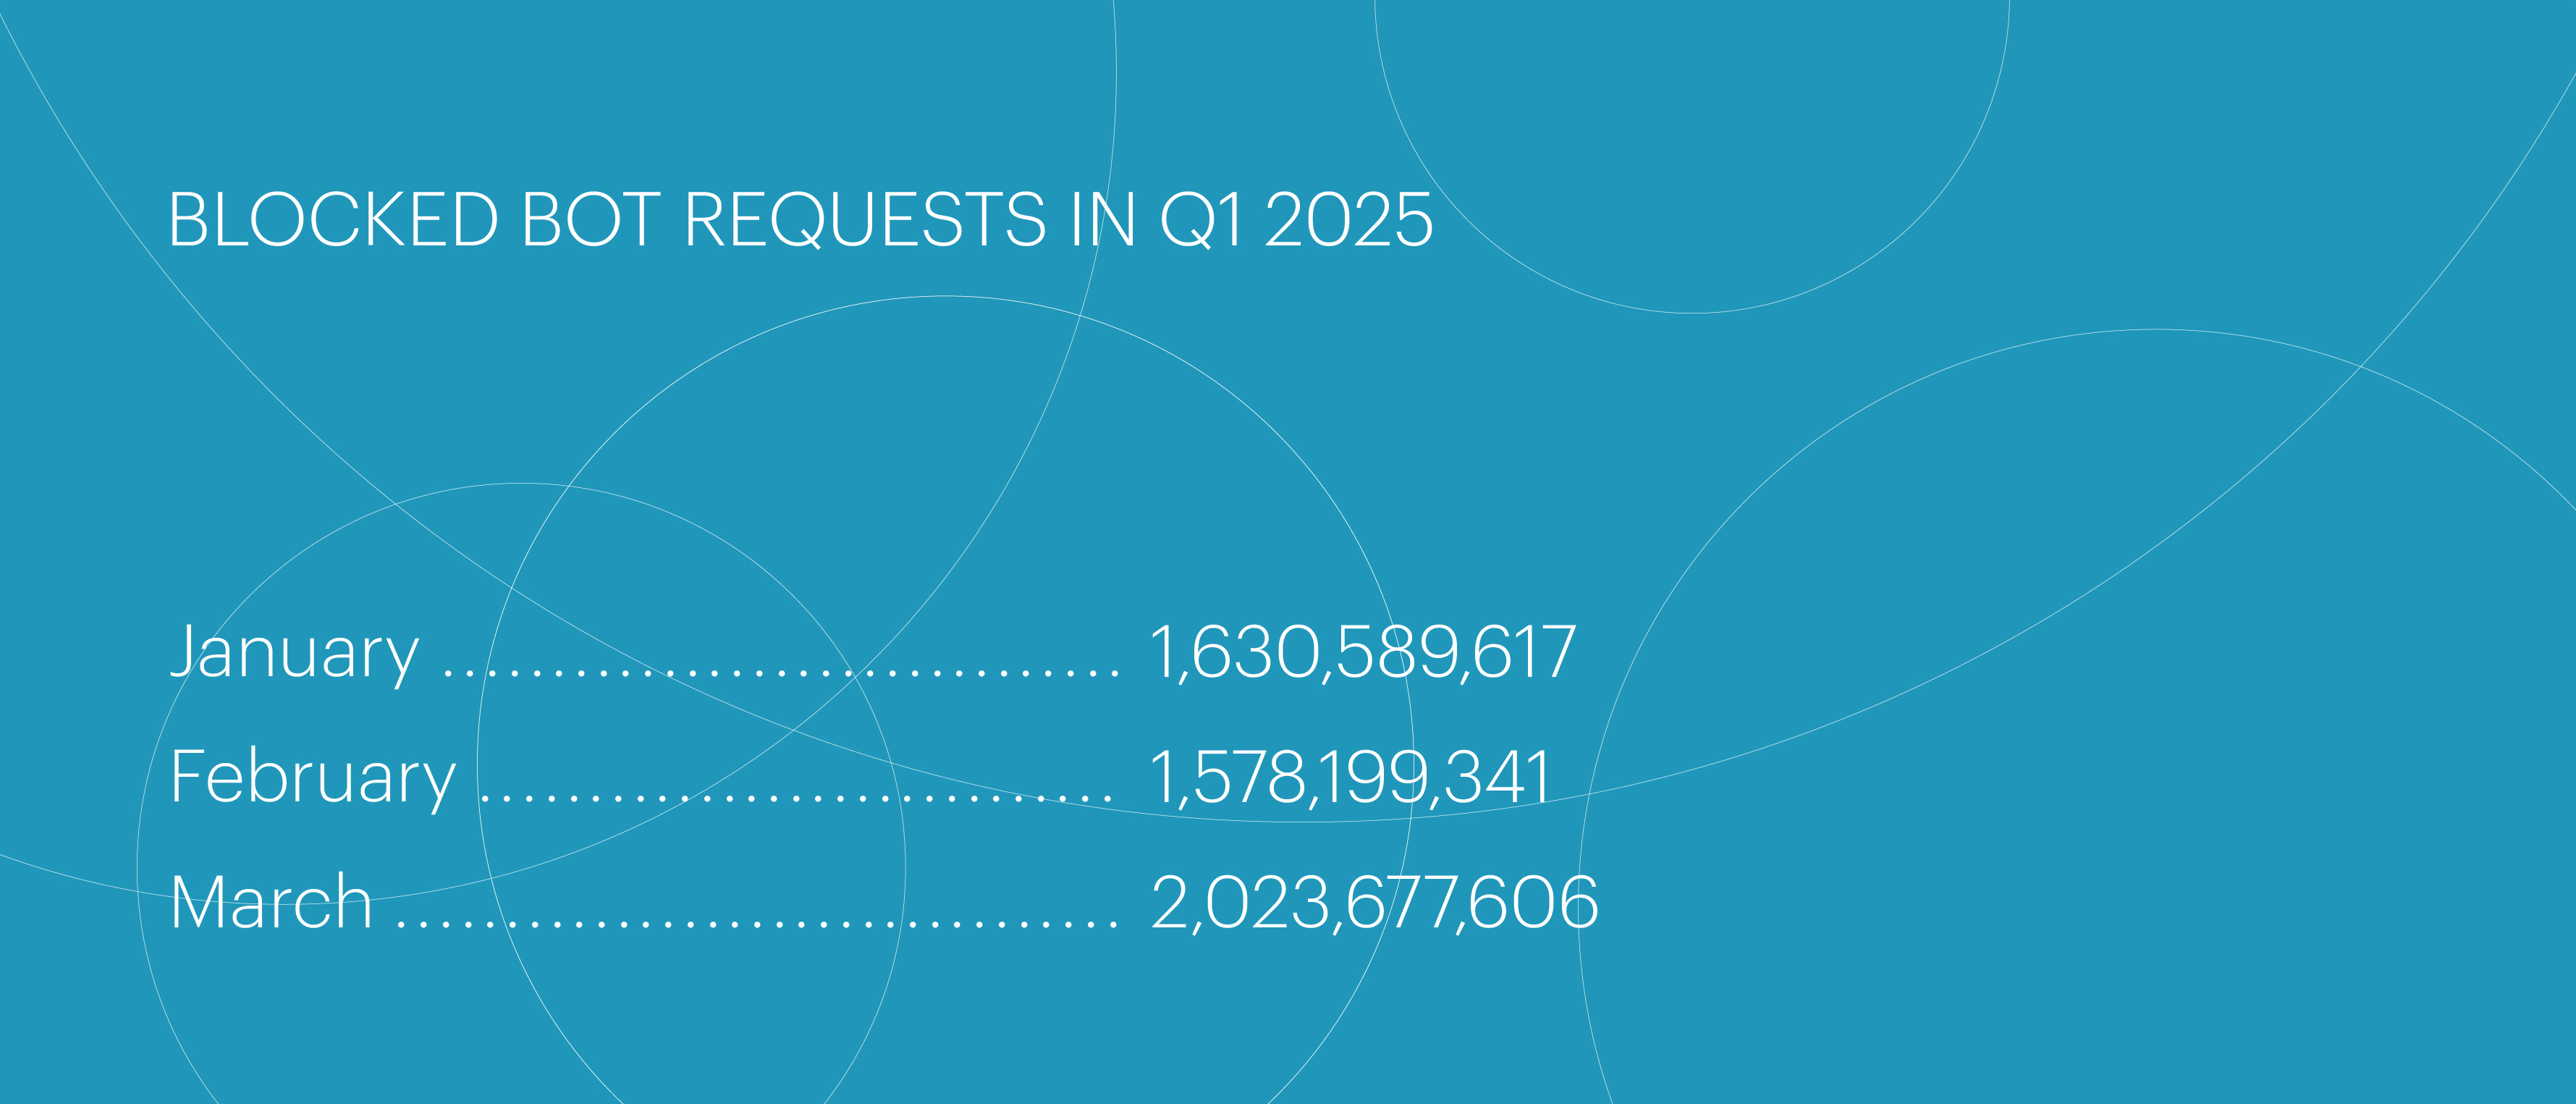
In Q1 2025, the number of blocked bad bot requests showed moderate growth compared to both the previous quarter (+5.7%) and Q1 2024 (+3.9%).
Following the quiet winter months, bad bot activity increased noticeably in March — the number of blocked requests jumped by 28%.
The majority of bad bot attacks this quarter targeted the following segments: “Online retail” (40.7% of all bot activity), “Online betting” (13%), “Real estate” (8.2%), “Pharma” (4.8%), “Logistics” (3.3%), and “Finance” (0.6%). Together, these six segments accounted for over two-thirds of all bad bot attacks we recorded.
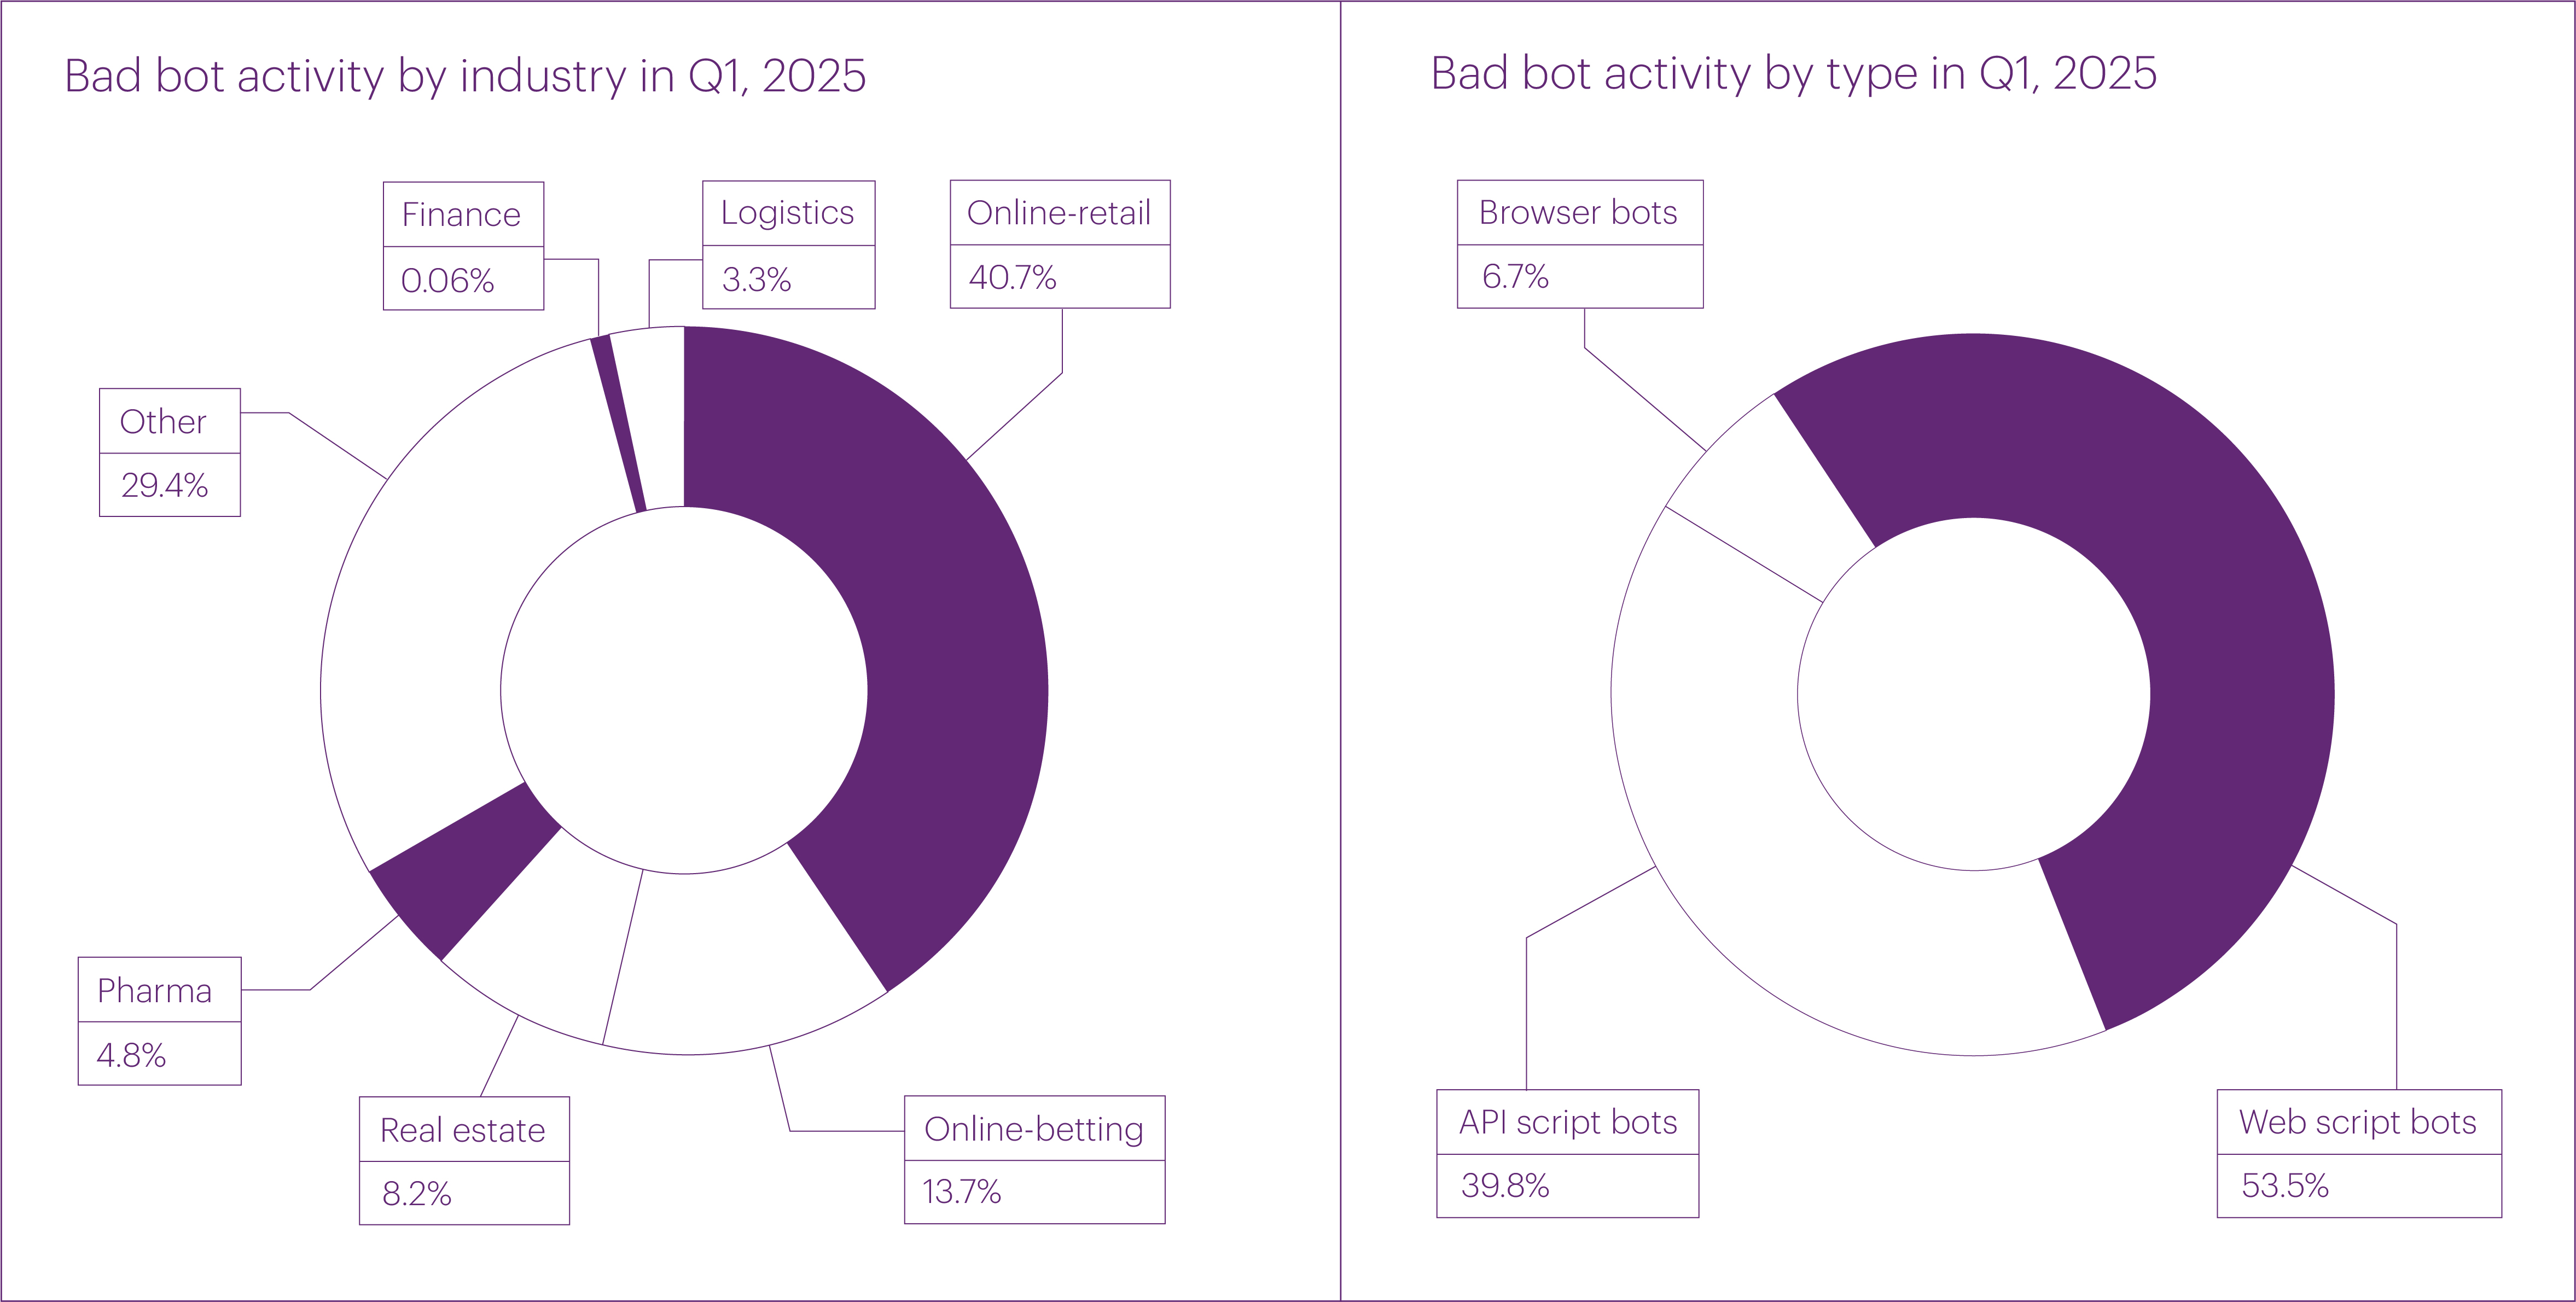
Bad bot types were distributed as follows: the majority were script-based bots (53.5%), followed by API bots (39.8%) and browser bots (6.7%).
The largest bad bot attack of the quarter was recorded on March 21 and targeted the “Online betting” segment. During mitigation, 14,333,475 bot requests were blocked. The attack maintained an average rate of 166 rps, peaking at 594 rps.
The fastest bot attack of the quarter occurred on March 9 and targeted the “Online retail” segment. It peaked at 56,500 rps in the second minute of the attack. Lasting around five minutes, the attack resulted in 12,585,661 blocked requests, with an average rate of 41,952 rps.
During the attack, traffic was directed to an online store’s homepage and popular sections of its product catalog. It combined an L7 DDoS attack using primitive bots with more advanced bot activity designed to mimic real users’ web browsers.
In total, over 8,000 IP addresses were blocked for generating malicious traffic. The top five source countries for this mixed attack were the United States (14%), Indonesia (11%), Russia (7%), Singapore (6%), and Germany (5%).
In March, another notable bad bot attack targeted the application of a major airline. From March 13 to 19, more than 2,500 bots simulated the behavior of real users, requesting flight search results and ticket prices for popular destinations. The traffic originated from both residential IP addresses and proxies located in Russia, the U.S., Singapore, Germany, and Canada. The intensity was relatively low, peaking at 60 rps.
What made this attack unusual was its vector: the malicious traffic was directed not to the main application host, but to a domain used for serving static content such as images, videos, and scripts. The attackers likely assumed that requests routed through a content delivery network (CDN) would be treated as trusted and bypass security checks. However, the anomaly was quickly detected, and the malicious activity was blocked.
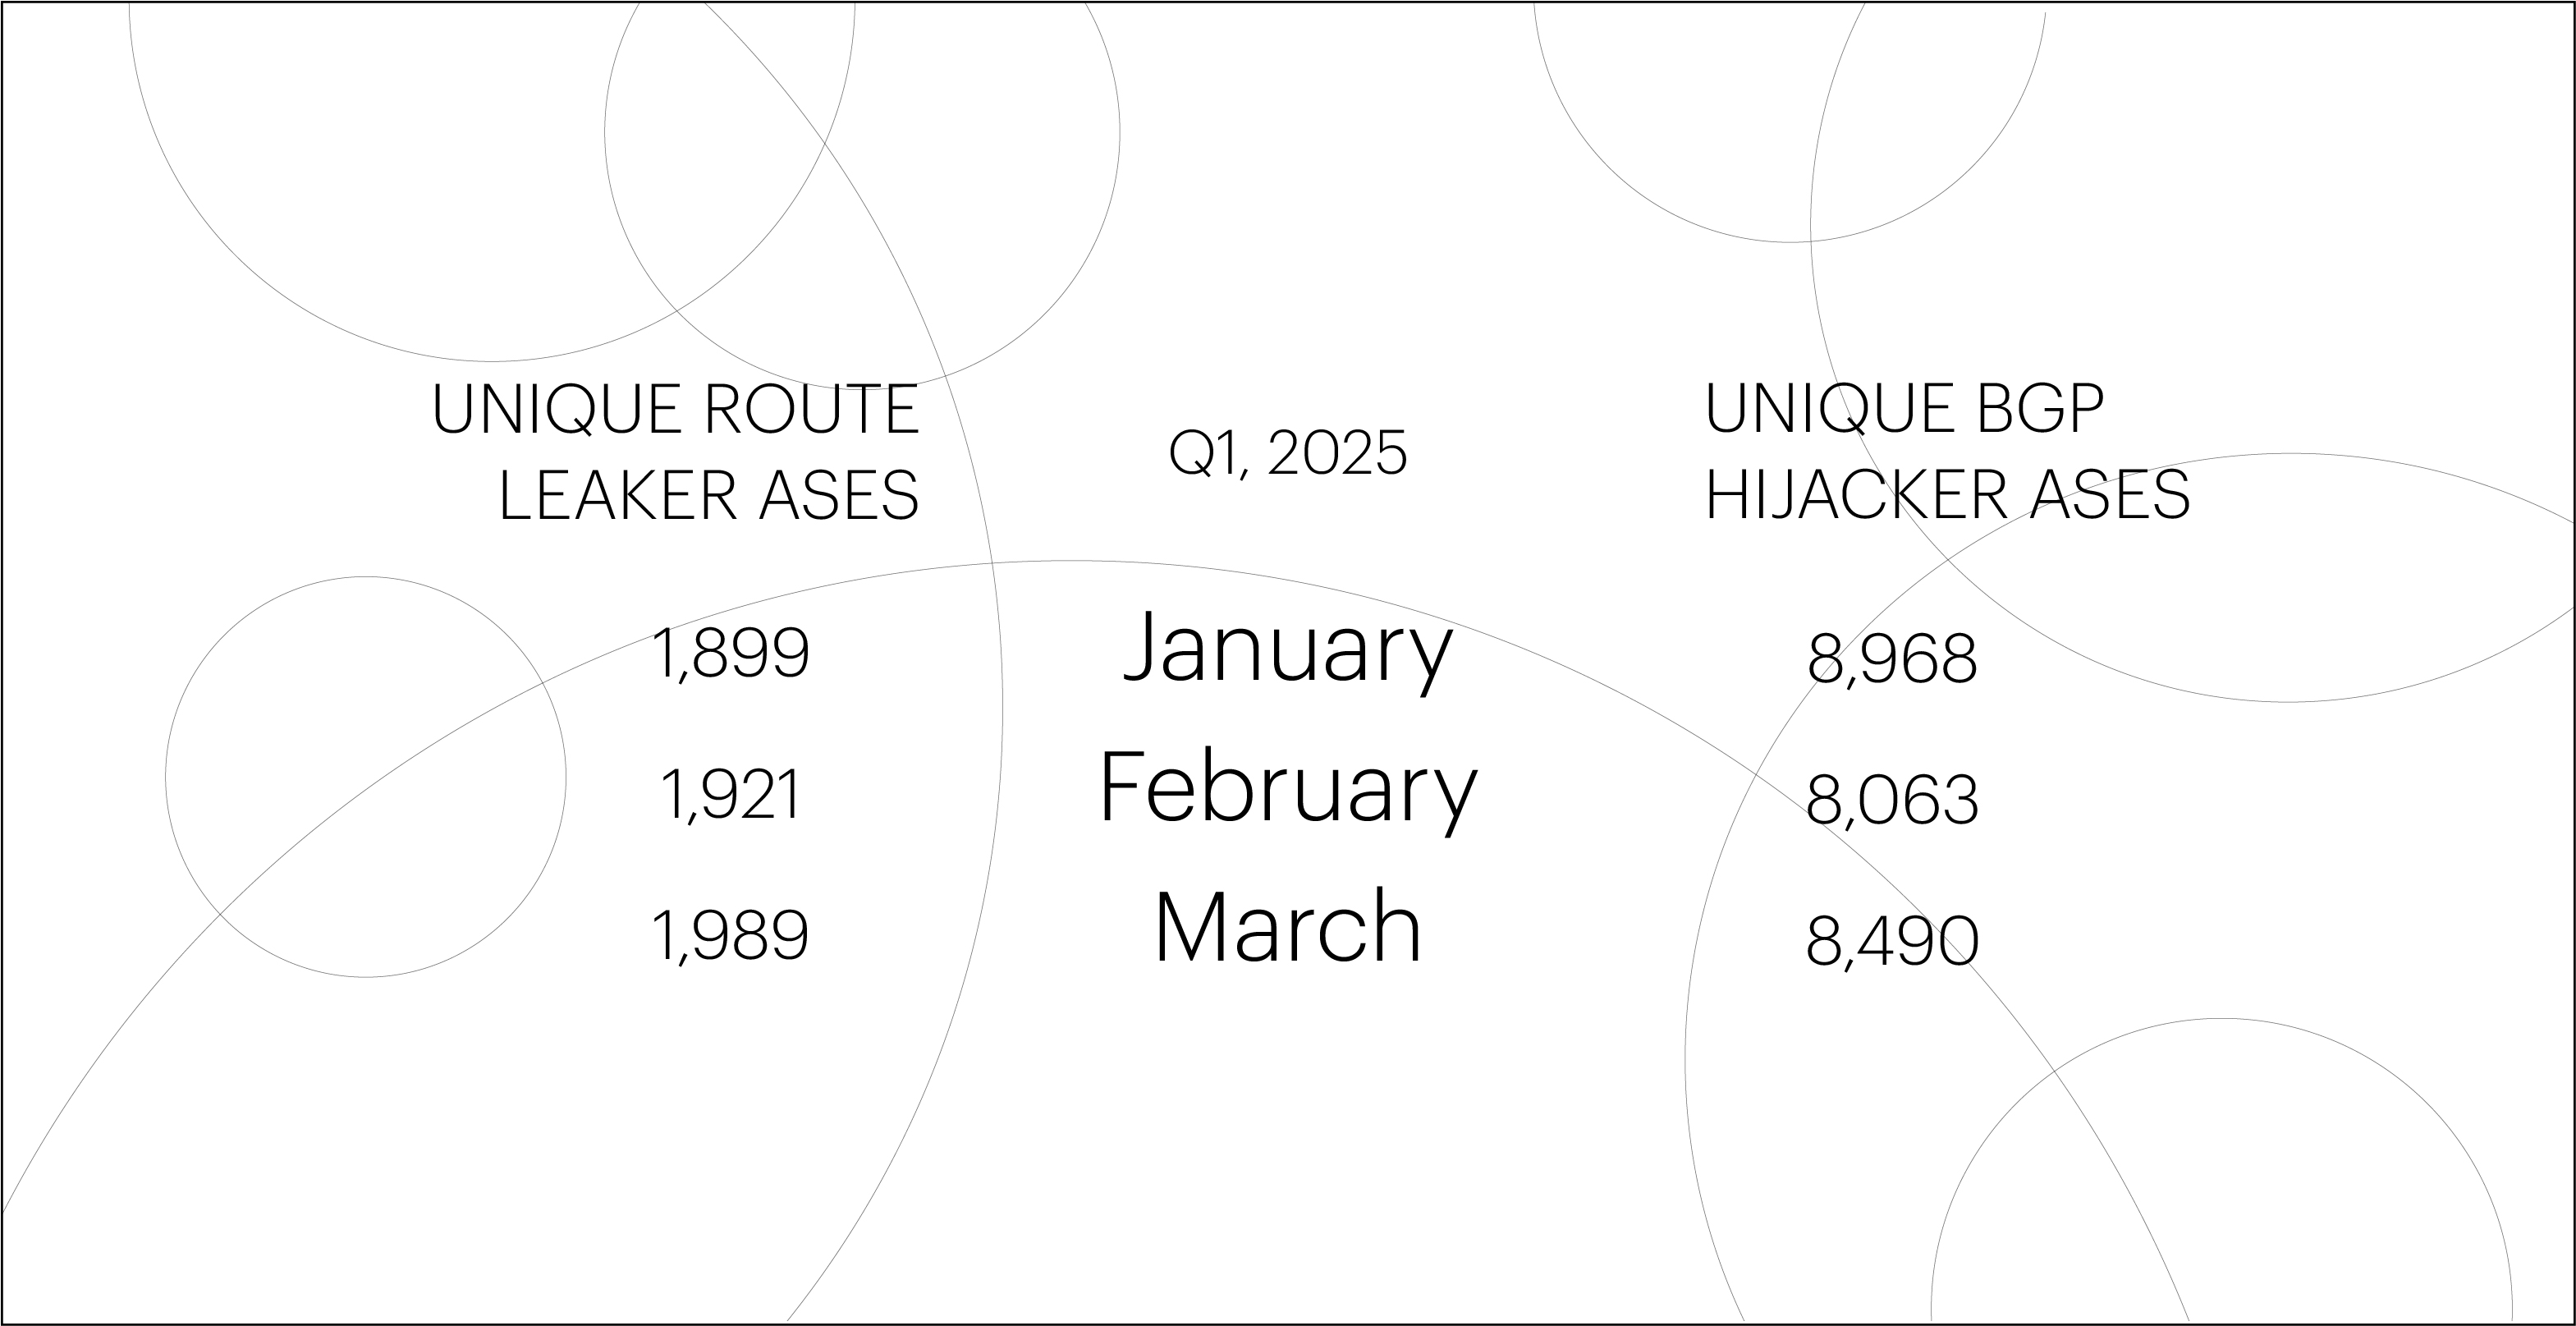
The number of unique autonomous systems (ASes) responsible for BGP route leaks in Q1 was roughly the same as a year earlier (–1.6%). Meanwhile, the number of ASes responsible for BGP hijacks in Q1 2025 dropped significantly compared to Q1 2024 (–17.6%).
This decline is most likely due to the continued large-scale adoption of the RPKI ROA security mechanism, which effectively helps prevent BGP hijacks. In contrast, protection mechanisms against route leaks are still far from widespread implementation and therefore have little impact on the number of such incidents.
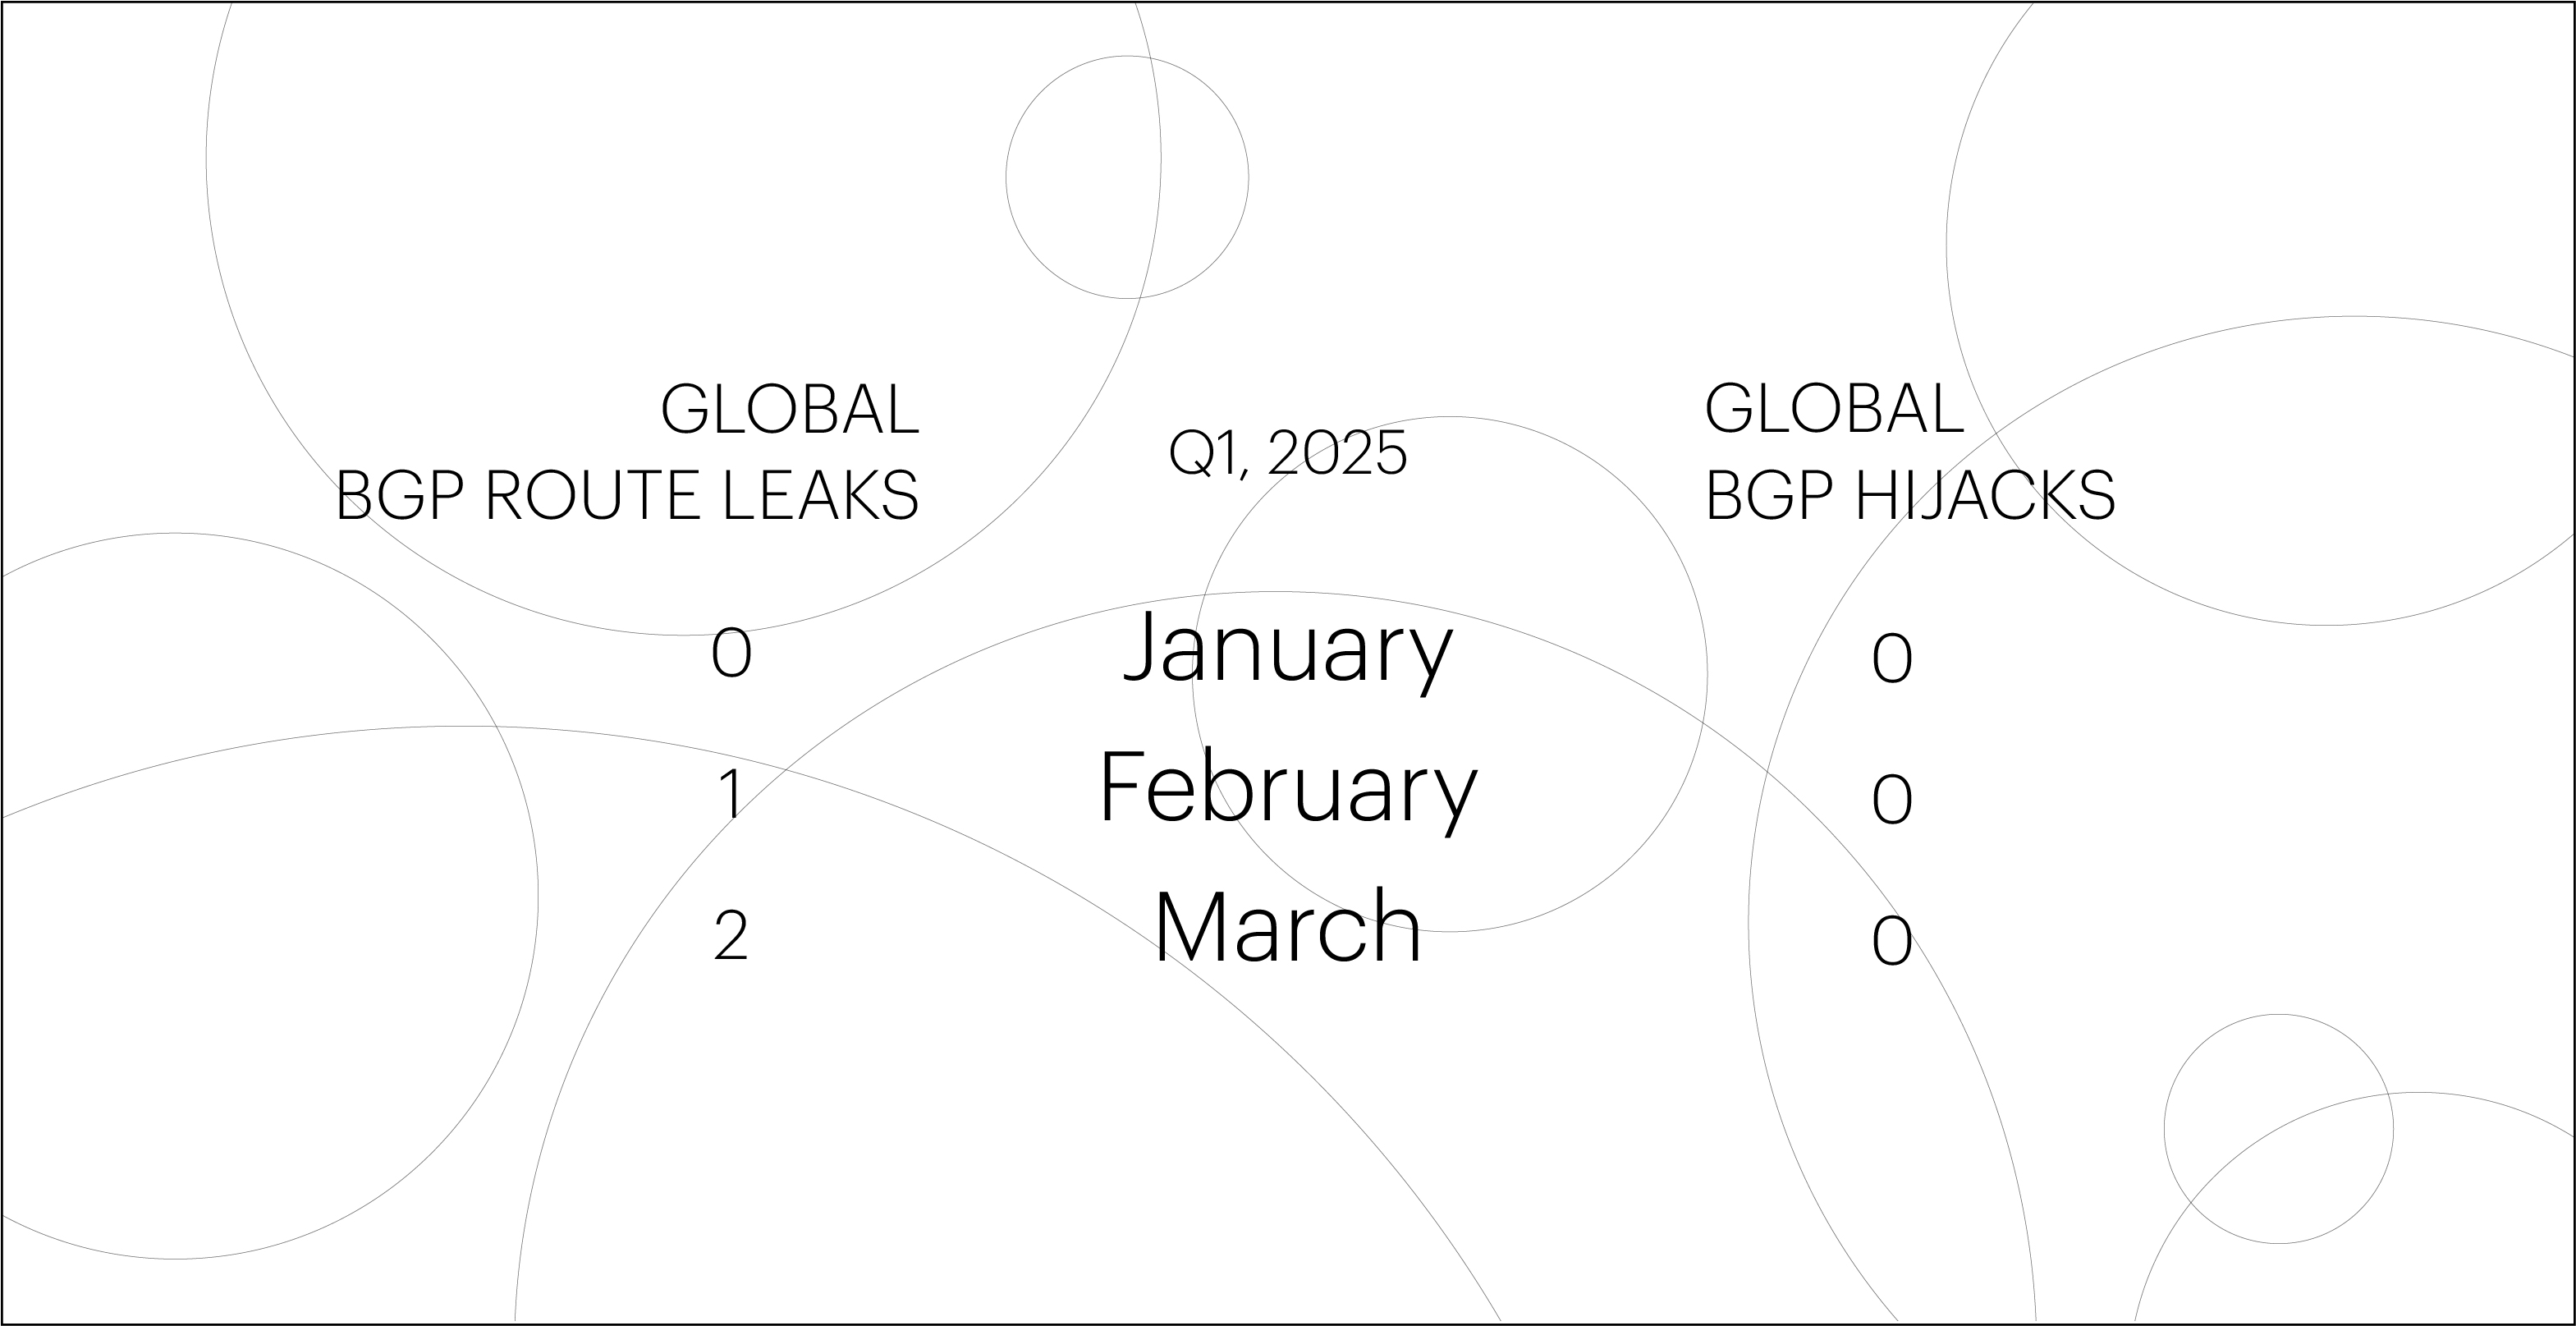
Global BGP incidents
Note: The Qrator.Radar team identifies global BGP incidents using a set of threshold criteria. These include the number of affected prefixes and autonomous systems, as well as the extent of the anomaly’s propagation across routing tables.
Regarding global BGP incidents, after a rather active 2024, the first quarter of 2025 was unexpectedly quiet. We recorded only three global incidents — all of them BGP route leaks, with not a single BGP hijack.
For comparison, the average in 2024 was 3.6 global incidents per month. In Q1 of that year alone, we detected 12 global BGP route leaks and 1 case of global BGP hijacking.
Share your experience and expectations regarding DDoS protection. Your answers will help us tailor solutions to meet your cybersecurity needs.
Tell us about your company’s infrastructure and critical systems. This will help us understand the scope of protection you require.
Help us learn about how decisions are made in your company. This information will guide us in offering the most relevant solutions.
Let us know what drives your choices when it comes to DDoS protection. Your input will help us focus on what matters most to you.
