We started the network security market analysis in the first quarter of 2024 with adjustments to the data collection methodology, as promised in the 2023 year-end report. Specifically, we filtered out all incidents with bandwidth below 1 Gbps to focus on significant events. As mentioned in the previous report, due to the increase in channel bandwidth, the intensity and size of attacks are also growing. As a result, by the end of the year, we introduced a new term in network security terminology – "white noise" – minor traffic spikes with low intensity (up to 1 Gbps).
As a result of the analysis methodology changes, the distribution of mixed attacks by vectors changed in the first quarter of this year. The UDP flood, which previously occupied the top positions and was actively growing, moved to second place with a share of 24.64% (-35.55% compared to the previous quarter and -12.56% compared to the same period last year). IP fragmented flood topped the list in Q1 2024 with a share of 40.76%. Mixed attacks UDP + IP fragmented flood closed the top three leaders with 12.32%. TCP flood ended up in the fourth position with 10.90%. It is worth noting also the fifth position – a combination of three vectors UDP + IP + TCP flood, with the total volume of attacks amounted to 5.21%.
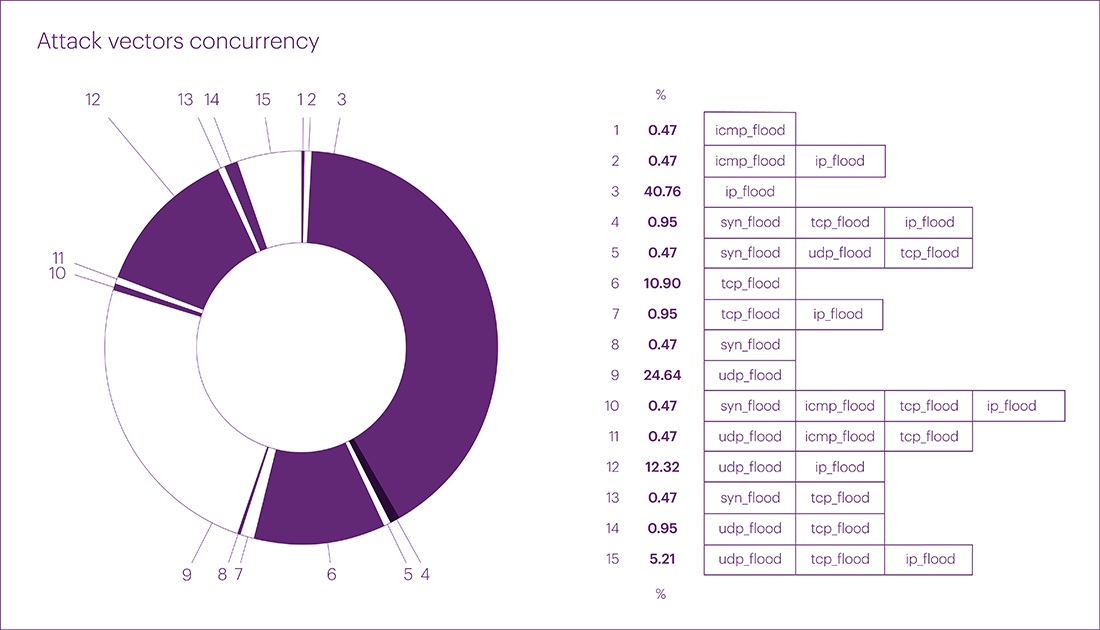
In total, the volume of mixed multivector attacks amounted to 23.22%, which is almost twice the previous quarter’s figure. We attribute this primarily to the increase in available capacities. For experienced hackers and hacktivists, this provides the opportunity to organize a large number of attacks in the form of "carpet bombing" – multivector attacks. Defending against DDoS attacks of this nature is more challenging than against targeted attacks simply because most DDoS providers protect individual IP addresses rather than entire infrastructures and networks. Thus, the main focus in detecting and eliminating threats is given to individual IP addresses rather than networks. This is precisely why multivector attacks on unprotected or partially protected infrastructures can achieve their goals (and this figure may continue to rise).
As can be easily seen from the adjusted statistics, predominantly UDP flood attacks constituted "white noise" last year. Throughout the year, we explained the significant growth of this attack vector, associated with the expansion of channels and the addition of new remote communication tools in organizations.
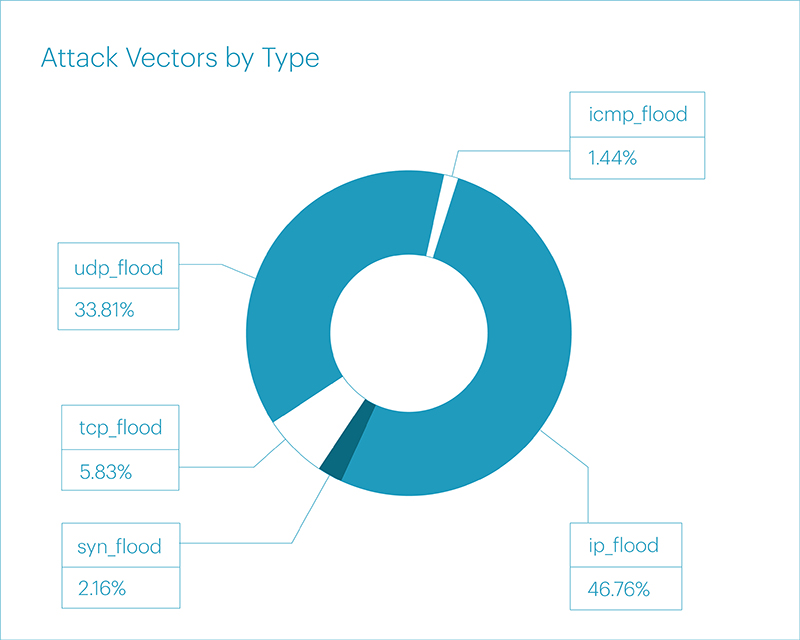
Now, looking at the statistics from a new perspective (attacks with bandwidth of over 1 Gbps), it is evident how much IP flood has surged ahead, showing an increase of 23.90% compared to the same figure in the fourth quarter of last year and 31.03% compared to the first quarter of last year.
In terms of net vector distribution statistics, the rankings were distributed in a similar order, without considering mixed vectors:
The duration of attacks in the first quarter of 2024 immediately set high benchmarks. Based on the results of 2023, the longest continuous attack was a multivector incident in the Airports segment (Transport and Logistics Macrosegment), which lasted about three days in total and peaked at 5.94 Gbps. However, by the end of the first quarter of 2024, the longest incident lasted for 464 hours, or almost three weeks (19.5 days). A single-vector attack in the form of TCP flood occurred in the E-commerce segment and peaked at 279.87 Gbps.
The average duration of attacks, considering peak values, in the first quarter was 4 hours. And the duration of attacks without considering peak values – at the 90th percentile – averaged 95 minutes.

In terms of attack vectors, the ranking of attack durations is as follows:
The most intense UDP flood attack in the first quarter was recorded in the Online Betting segment, peaking at 881.75 Gbps. This figure, similar to the previous one (the longest attack), broke the record of the previous year in the Food retail segment in the first quarter of 2023 and amounted to 690 Gbps at its peak.
Second place was taken by TCP flood with a bitrate of 620.88 Gbps at its peak. IP fragmented flood closed the top three leaders with a peak value of 270.46 Gbps. The complete statistics of attack bandwidth for the first quarter are as follows:
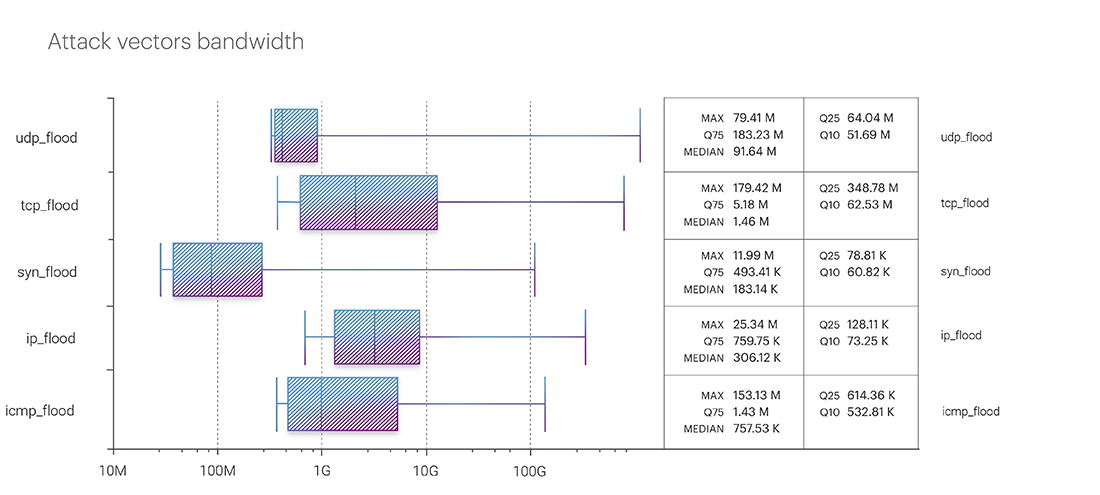
Based on historical 2021 - 2024 data (considering data only for the first quarter of each year), the dynamics of attack intensity are as follows:
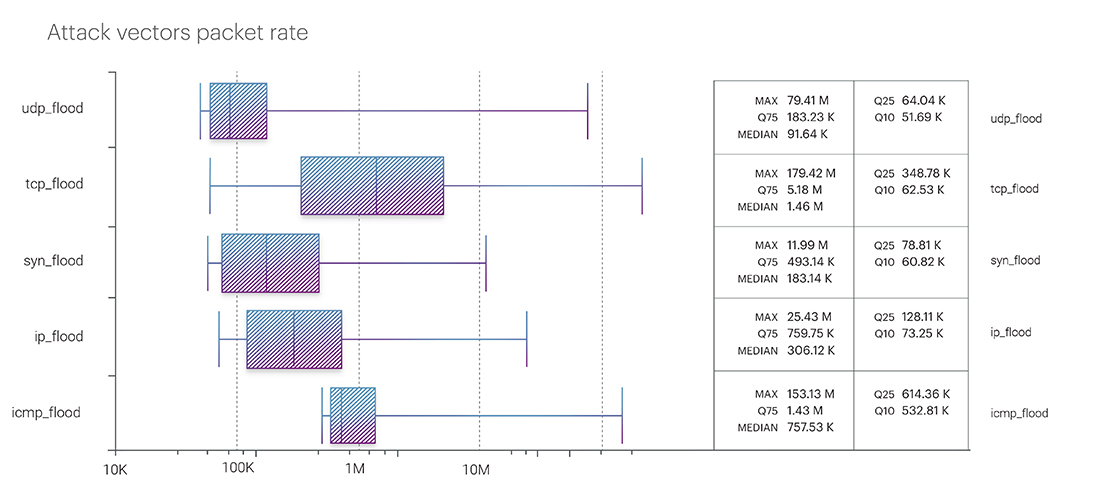
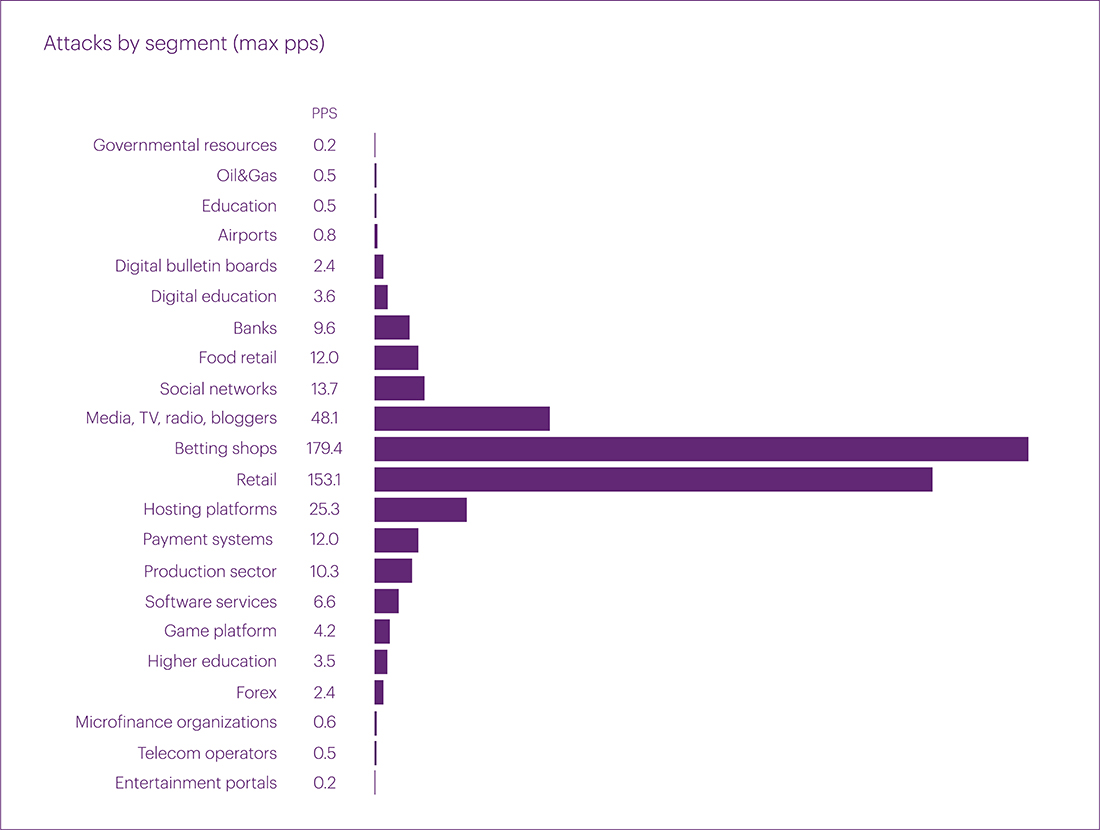
The picture in the packet intensity ranking looks different. The top position in the ranking was taken by TCP flood, with a rate of 179.42 Mpps. Next is ICMP flood – 153.13 Mpps. And closing the top three is UDP flood – 79.41 Mpps:
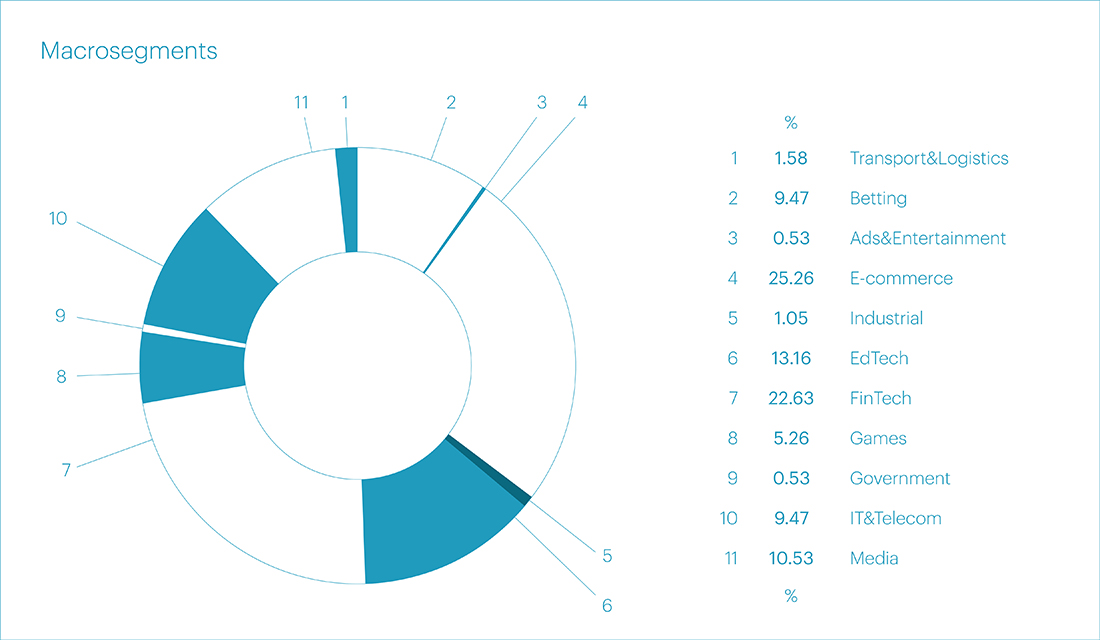
In the first quarter of the current year, the highest number of attacks occurred in the E-commerce segment – 25.26% of all attacks. The Financial Technology segment followed in the second place with 22.63%. And the third place was taken by Educational Technologies – 13.16%.
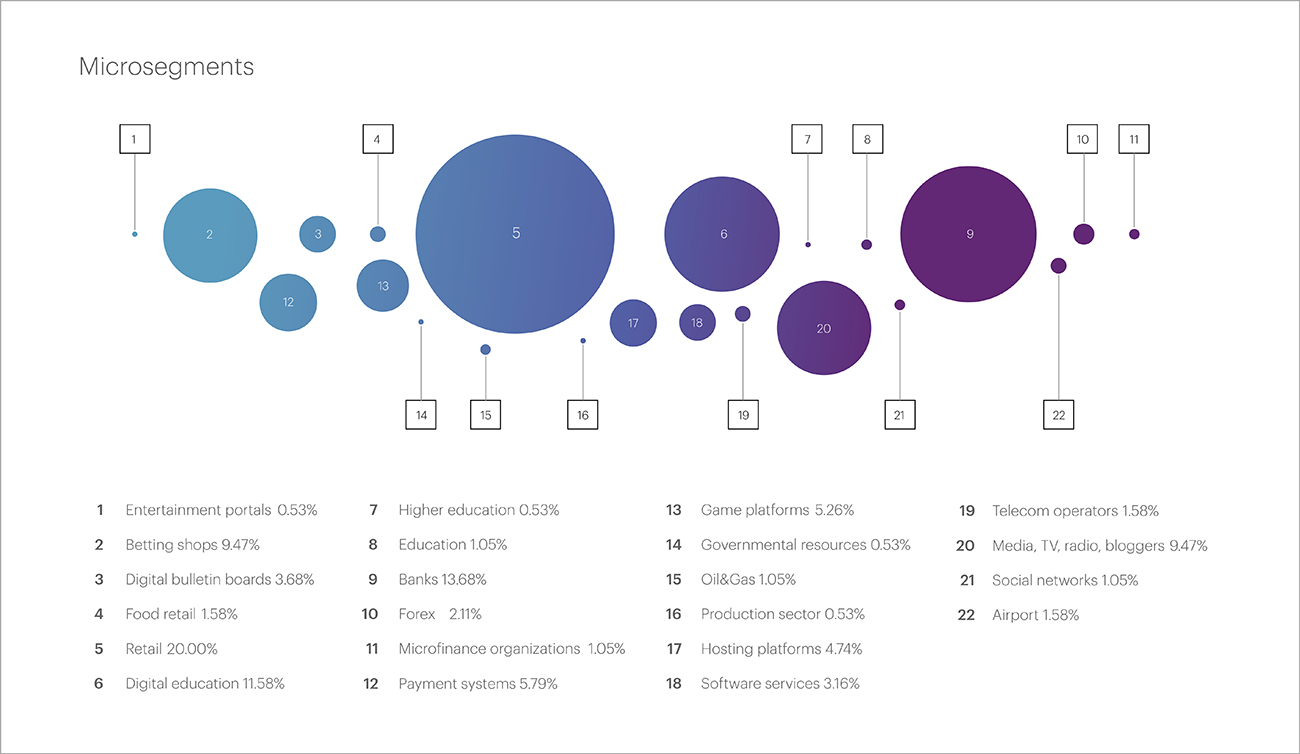
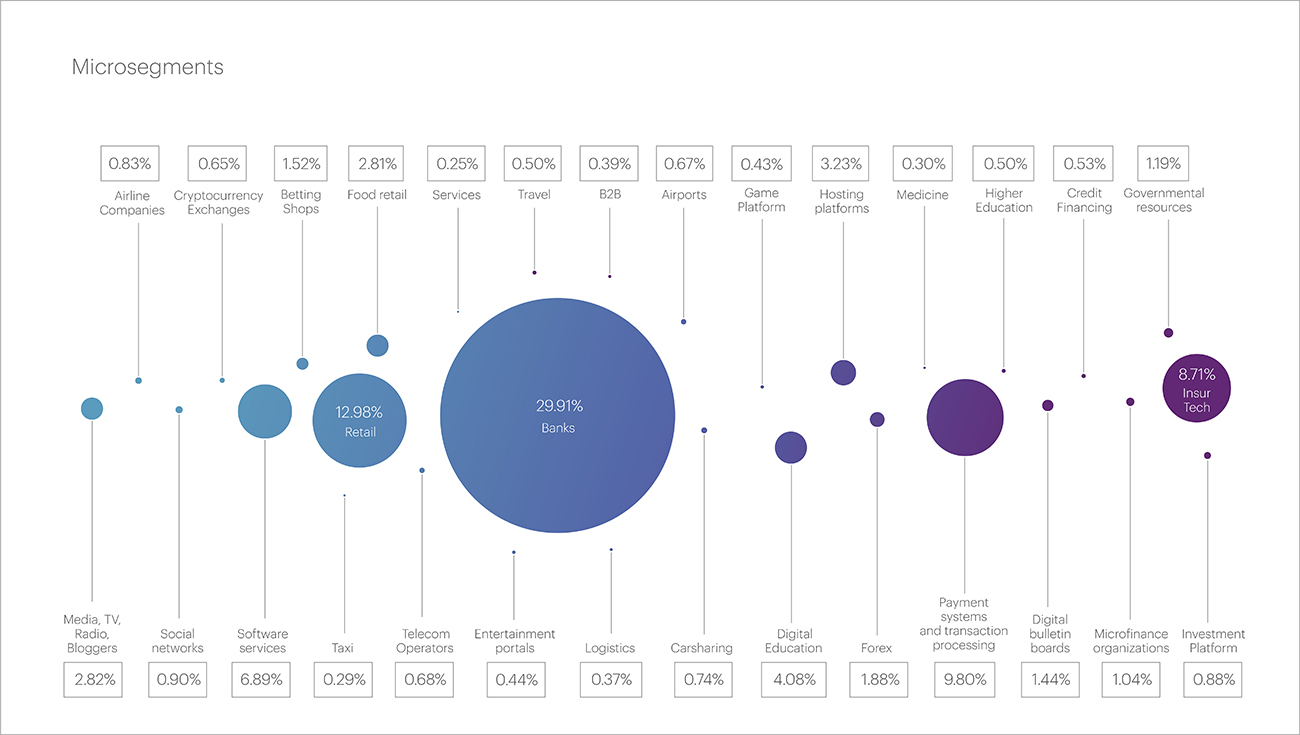
In the statistics of micro-segments, the rankings were distributed as follows:
The longest attack occurred in the Online retail segment (E-commerce). As mentioned above, the incident took place from February 1st to February 20th, lasting almost three weeks. The second longest attack was recorded in the Online Betting segment, lasting 72 hours. Closing the top three is an attack in the banking segment, which lasted almost 6 hours.
Regarding attacks bandwidth, the most significant indicators were in the segments of Online Betting, Online retail, and Hosting platforms – 881.8 Gbps, 686.6 Gbps, and 270.5 Gbps, respectively. In addition, it is worth noting four subsequent incidents that, in our view, deserve additional attention. These include the segments of Media, Social networks, Food retail, and the Production sector. All attacks in these segments reached peak bandwidth of over 100 Gbps:
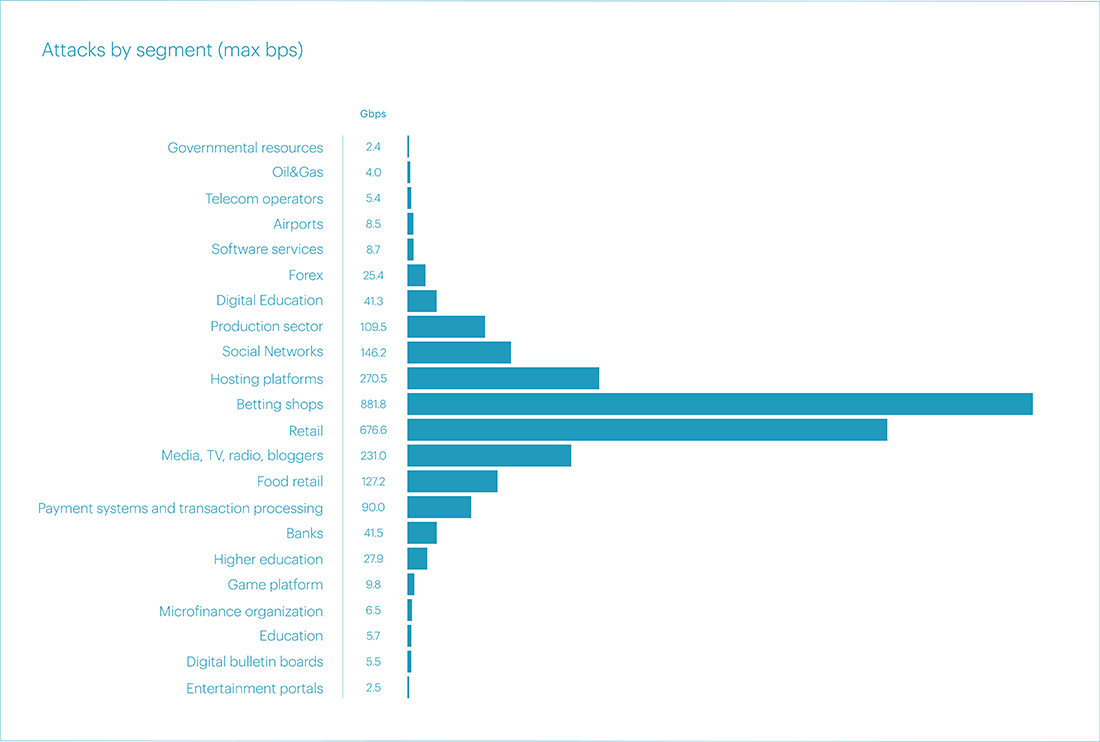
Previously, attacks on the Production sector were rare, but this year's figures from the first few months bring surprises and prompt consideration of emerging new trends in network security.
All of the above cases, in our view, exhibit signs of commercial attacks, which began to gain popularity last year. This is natural, as we have already discussed the expansion of communication channels, the transition to new protocols to optimize the operation of remote offices, and the ease and low cost of organizing DDoS attacks. All of this provides good opportunities for impact on businesses for malicious actors. As a result, reputation risks, direct financial losses, missed profits, disrupted marketing campaigns, resources spent on restoring system functionality, and so on.
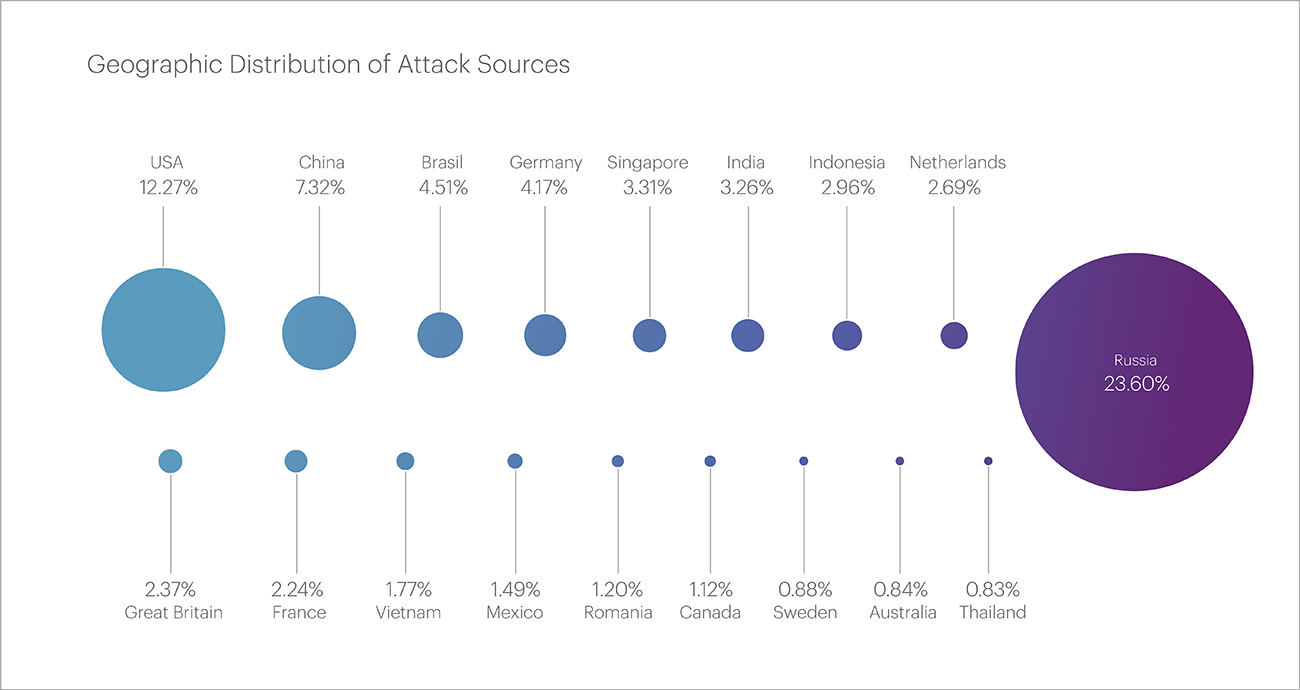
The top three countries – the main sources of malicious traffic - have remained unchanged for several quarters in a row.
Russia, as before, topped the Top 20 with 23.6% of IP addresses blocked in the first quarter, which, however, is almost half the figure of the fourth quarter of 2023 – 42.03% of the total. The United States and China ranked second and third, with 12.27% and 7.32% of the blocks, respectively.
The list of top leaders also did not undergo significant changes, however, the indicators for many countries almost doubled compared to the fourth quarter of 2023: Brazil (4.51%), Germany (4.17%), Singapore (3.31%), India (3.26%), Indonesia (2.96%), the Netherlands (2.69%), and the United Kingdom (2.37%).
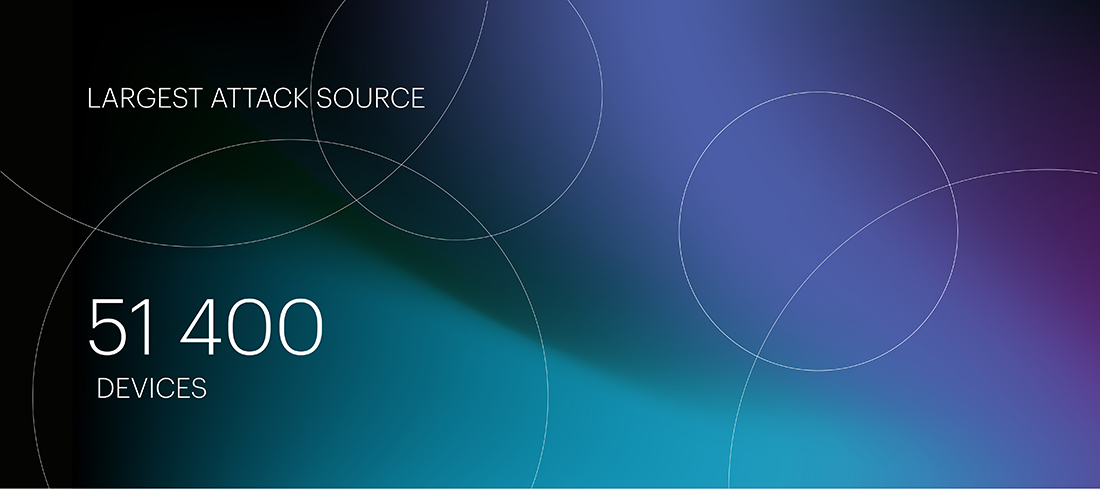
The largest botnet in the first quarter exceeded the figures of the fourth quarter of 2023 by more than 3 times, but turned out to be 2.5 times smaller than the largest botnet of the same period last year. The botnet consisted of 51,400 devices. Recall that in the previous quarter, this figure was 16,000 devices, and a year earlier (in the first quarter of 2023) - 131,628.
The botnet attack occurred on February 19 in the Online Betting segment. The botnet devices were detected in 9 countries: Indonesia, the United States, Russia, Colombia, China, India, Brazil, the Philippines, and Germany.
In the first quarter of 2024, the number of application layer attacks decreased by 22% compared to the same period last year. This further confirms our hypothesis regarding the more targeted nature of L7 attacks due to the high cost of organizing such attacks and vulnerabilities in the HTTP/2 protocol, which we discussed in our report for the third quarter 2023.
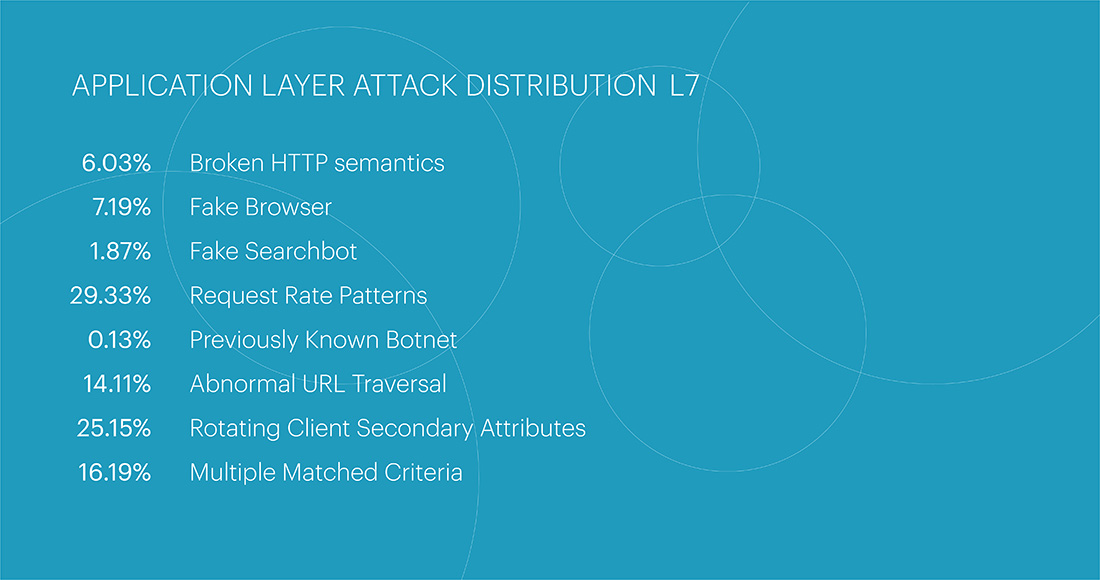
The statistics for the most popular classes of attacks in the first quarter are as follows. The most popular among attackers remains last year's leader - Request Rate Patterns which are indicators of behavior that deviates from expected legitimate user behavior in terms of request frequency - 29.33%. The second most popular class was Rotating Client Secondary Attributes - an unusual set of headers in the request - with a share of 25.15%. Closing out the top three were multi-class attacks - Multiple Matching Criteria - at 16.19%. The number of attacks in this class has remained at the same level relative to other classes for three consecutive quarters.
The majority of attacks in the first quarter of this year targeted the Financial Technology segment, accounting for more than half of all attacks - 54%. At the micro-segment level, the main targets within the Financial Technology segment were Banks (29.91%), Payment Systems (9.8%), and Insurance Companies (8.71%).
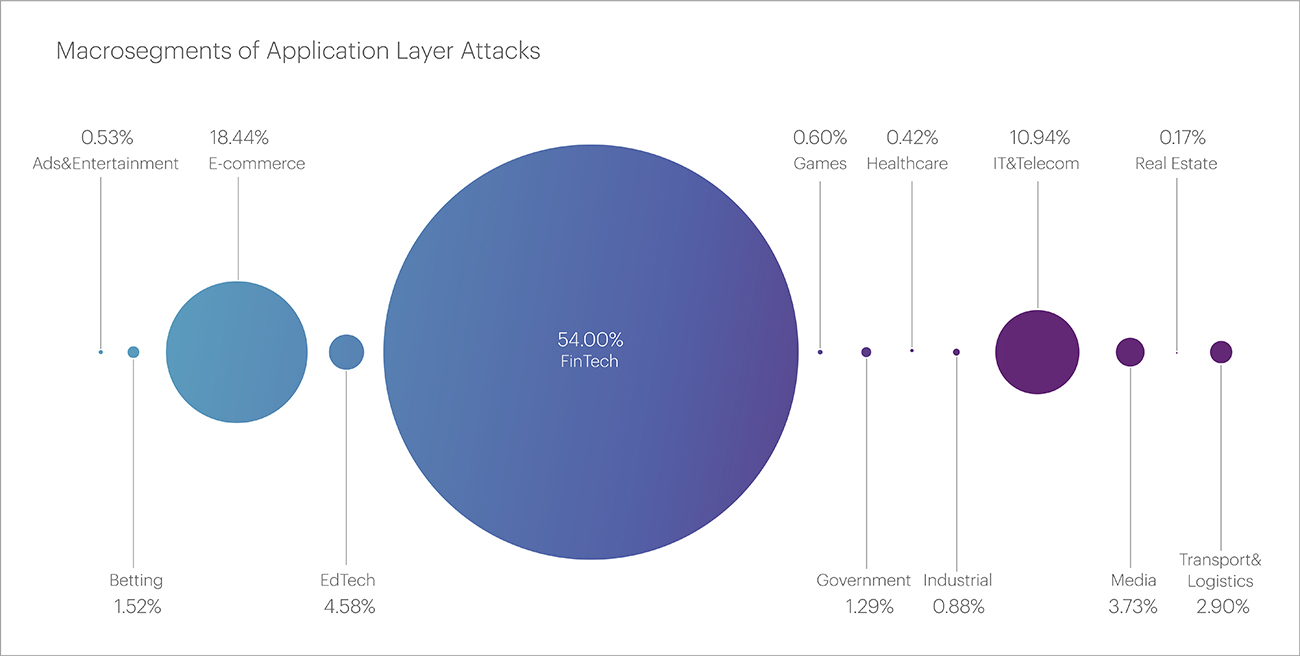
The second-largest macro-segment was E-commerce with a share of 18.44%. The IT and Telecom segment ranked third with 10.94%.
At the micro-segment level, as noted above, Banks were the most frequently targeted by attackers (29.91%). Online Stores were second with 12.98%, followed by Payment Systems and Insurance Companies.
Within the Banking segment, more than a quarter (25.42%) of all attacks were in the class of Rotating Client Secondary Attributes. Nearly as many (25.06%) were Request Rate Patterns attacks. The third most popular were multi-class attacks (18.28%).
It was this segment - Banks - that experienced the highest attack indicators this quarter. The attack with the highest request rate per second (RPS) in the first quarter was a multi-class attack on the Banking segment, peaking at 220,000 requests per second. This figure is far from last year's records, where the third-highest attack had an intensity of over 289,000 requests per second.
Additionally, another attack in this segment had the highest number of devices involved - 243,879. It also had the longest continuous attack, lasting 21 hours.
Compared to the fourth quarter of 2023, the number of bot attacks increased by 18.4%, totaling 5,037,483,945. This period did not see any sharp spikes in volume or duration of attacks; instead, there was a gradual increase and decrease in load. The most active month of the first quarter was January, which accounted for the most attacks: 1.8 billion blocked bot requests.
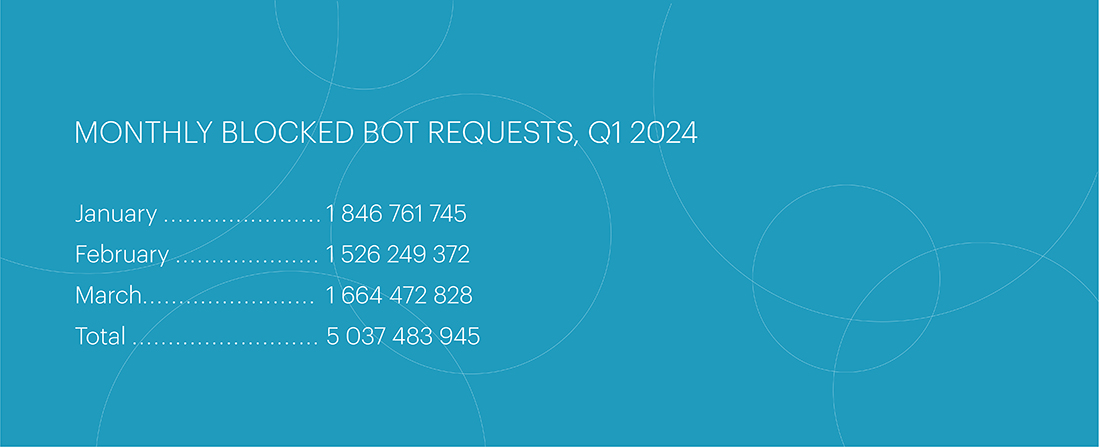
Blocked Bot Requests by Month, Q1 2024
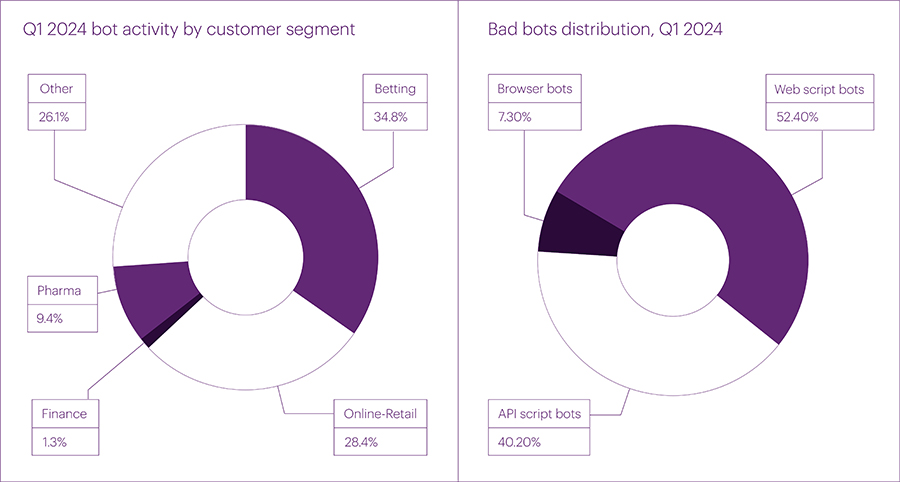
In the first quarter, there was a significant shift in bot attacks towards the betting sector (34.8%) due to increased demand for online betting content from both legitimate users and bots. This sector not only saw an increase in overall traffic and "white noise" bot activity but also a rise in the number of spikes.
The online retail sector lost some ground, decreasing from 29.1% in Q4 2023 to 28.4% in Q1 2024. However, the pharmaceutical sector saw a notable increase in its share by almost a quarter (from 7.1% to 9.4%).
The largest bot attack occurred in the betting sector on March 2, with 22,258,587 requests, which is nearly 27% less than the peak attack of Q4 2023 in the online retail segment. The fastest attack was organized on February 19, also in the online betting sector, peaking at 79,300 bot requests per second (rps), which is twice the speed of the fastest attack in Q4 last year in the e-commerce segment.
Regarding the distribution methods exploited by bots, the situation has not changed significantly compared to the previous quarter. The number of sophisticated browser bots increased slightly (from 5.6% to 7.3%), mainly due to bot operators using new, more popular platforms that better bypass protection systems. A year ago, in Q1 2023, the share of browser bots was only 2%. This year, it is over 7%, indicating a steady growth of this method from quarter to quarter.
The shares of Web script bots and API bots changed insignificantly: these methods are still actively exploited, but due to the growth in the number of browser bots, a new balance of power is emerging in bot distribution methods. Bot traffic is steadily increasing, despite fluctuations around holidays. There was a slight dip in February between January and March, but this did not prevent overall bot activity in the quarter from growing by 18.4%.
In 2024 we anticipate active growth in the number of bot attacks. In retrospect, the first quarters of the year are often not the most active, and with the observed growth in white noise, isolated attack spikes, and the steady increase in browser bots, we expect robust growth of around 20% from the second and third quarters of this year.
The number of unique Autonomous Systems (ASes) involved in Route Leaks slightly increased compared to the fourth quarter of 2023, by approximately 10%, due to a large number of global Route Leaks at the beginning of January.
The number of unique ASes conducting BGP Hijacks also increased over the quarter but not significantly – from 12,373 to 15,000.
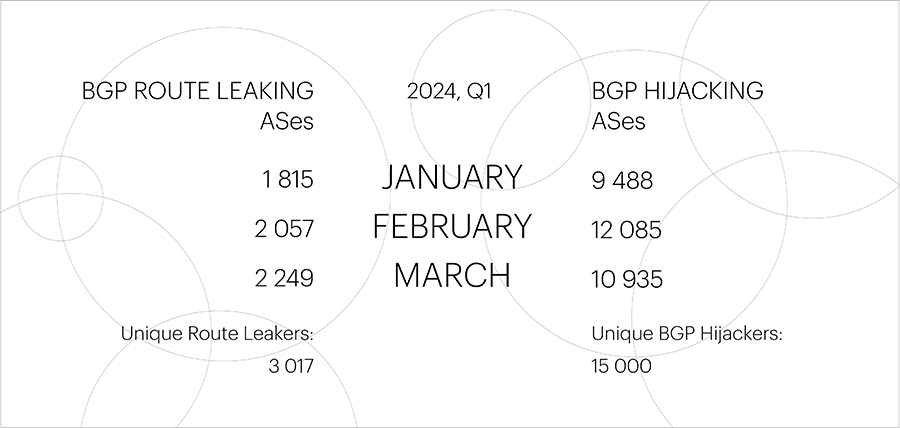
Global BGP Incidents
The Qrator.Radar team has a set of specific threshold values that distinguish global incidents from all others. These include the number of affected prefixes, autonomous systems, and the extent of anomaly distribution across routing tables.
The number of global Route Leaks in the first quarter of 2024 doubled compared to the previous period – from 6 to 12 per quarter. However, there was only one global BGP Hijack recorded, whereas there were none in the fourth quarter of 2023.
| Global BGP Route Leaks | Global BGP Hijacks
| January: 6
February: 4
March: 2 | January: 1
February: 0
March: 0
2024 started with a widely publicized incident involving Orange España, where a hacker breached the operator's account in RIPE NCC misconfigure BGP routing and an RPKI configuration, causing Orange's network outage.
Following this incident, several more route leaks affected a large number of countries. In early January, there were two major leaks from Brazilian telecom operators: IPNET TELECOM (affecting 2,868 ASes and 193 countries) and Wixnet (affecting 2,522 ASes and 193 countries).
Subsequently, there were two waves of leaks from the Kazakhstani operator TNS PLUS, affecting a total of 511 ASes and 146 countries.
February was marked by two route leaks: one by the Bangladeshi operator BDLink Communication, affecting 106 ASes from 16 countries, and the Singaporean company DIGISIGMA PTE. LTD (resulting in 4,234 conflicts for 43 ASes from 7 countries).
In March, there was a major leak from the Russian operator MTS, resulting in 4,065 conflicts for 329 ASes from 28 countries.
A complete description of all incidents by the date of occurrence can be found on the Qrator.Radar Twitter feed.


Share your experience and expectations regarding DDoS protection. Your answers will help us tailor solutions to meet your cybersecurity needs.
Tell us about your company’s infrastructure and critical systems. This will help us understand the scope of protection you require.
Help us learn about how decisions are made in your company. This information will guide us in offering the most relevant solutions.
Let us know what drives your choices when it comes to DDoS protection. Your input will help us focus on what matters most to you.